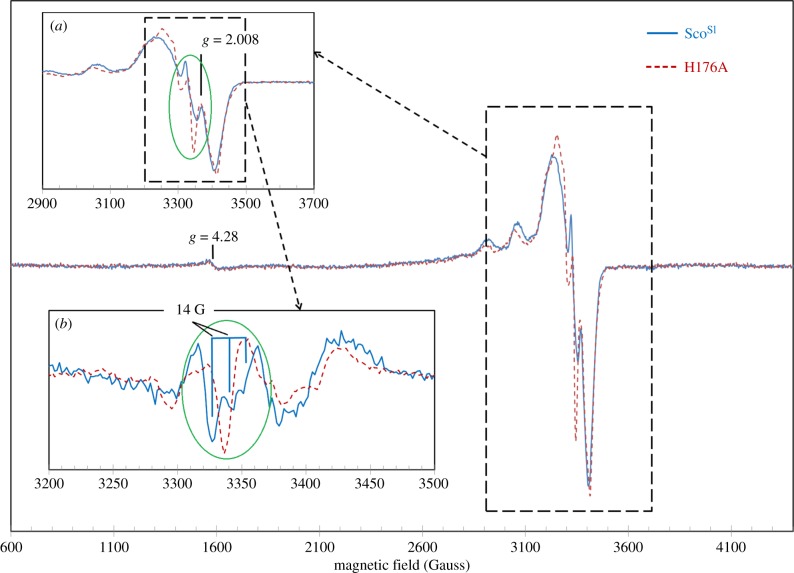
Figure 7.
EPR spectra of Cu(II)-loaded ScoSl and the H176A mutant. The superimposed spectra within the dashed line box are shown in greater detail in inset (a). Derivatives by field have been taken of both spectra and inset (b) shows the second derivatives of the EPR absorption. The most rapidly changing part of the spectra, as the field increases, is highlighted by an oval in both first (inset a) and second derivatives (inset b) of the EPR absorption. The latter representation demonstrates that instead of a single peak in the H176A mutant, there is a triplet with a 14 G separation between the lines in the wt protein spectrum. Instrumental conditions were as follows: microwave frequency νMW = 9.466 GHz, microwave power PMW = 3.181 mW, modulation frequency νm = 100 kHz, modulation amplitude Am = 5 G, time constant τ = 81.9 ms, scan rate V = 22.6 G s−1, number of scans per spectrum NS = 1, each spectrum represents an average of three spectra obtained from three independent samples.

