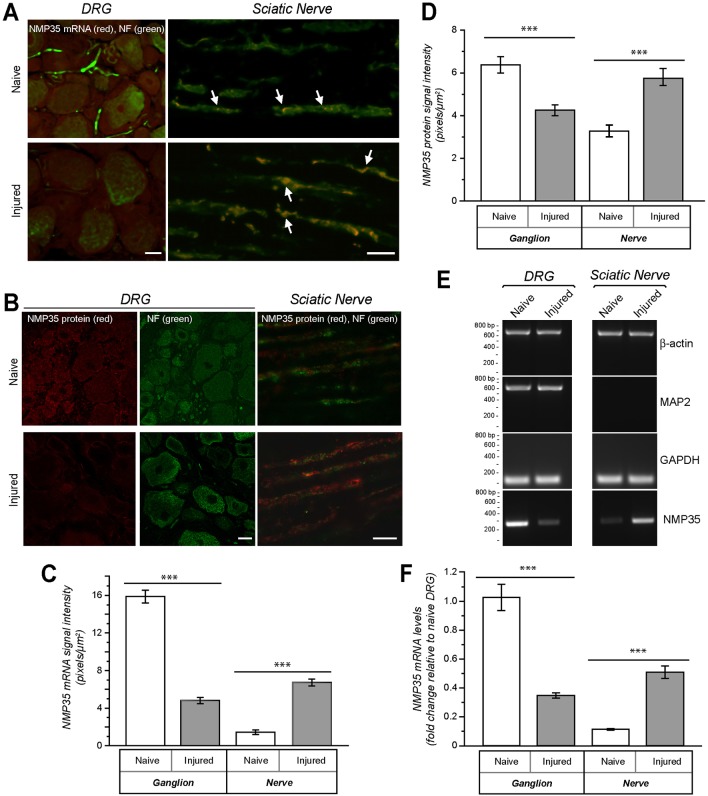
Fig. 2.
Axotomy increases axonal localization of NMP35 mRNA in vivo. NMP35 mRNA and protein levels were examined in naïve versus crush-injured sciatic nerves at 7 days after injury. The nerve was sampled just proximal to the crush injury with a corresponding level of naïve nerve sampled; L4-5 DRGs are illustrated. (A) Representative exposure matched confocal image pairs of naïve versus injured nerve for FISH/immunofluorescence show increased signal for NMP35 mRNA in axons of the injured sciatic nerve (arrows) and a decrease in NMP35 mRNA signal in the neuronal cell bodies of L4-5 DRGs compared with uninjured nerve and DRG. (B) Representative exposure-matched confocal image pairs as in A show a similar increased signal for NMP35 protein in the sciatic nerve and decreased signal for NMP35 protein in the L4-5 DRG neuronal cell bodies at 7 days after injury compared with uninjured nerve and DRG. (C) Quantification of NMP35 mRNA intensity that overlapped with neurofilament heavy (NF H) protein signal in naïve and injured sciatic nerve and DRG sections is shown. (D) Quantification of NMP35 protein intensity overlapping with NF H signal in uninjured and injured sciatic nerve versus DRG is shown. (E,F) RNA was purified from sciatic nerve and L4-5 DRGs, both naïve and at 7 days post crush injury, and used for RT-PCR to gain a more quantitative estimate of changes in NMP35 mRNA levels. Standard RT-PCR amplification of β-actin and GAPDH mRNAs shows relative equivalent loading between samples; absence of MAP2 mRNA in the sciatic nerve is consistent with the axonal nature of the neuronal processes in the sciatic nerve (E). NMP35 mRNA appears to increase in the nerve and decrease in the DRG following crush injury. RTqPCR similarly shows an increase in NMP35 mRNA in sciatic nerve and a decrease in DRG (F). 12S rRNA was used to normalize RTqPCR data (n≥20 from at least three separate experiments; ***P≤0.001 by Student's t-test for indicated data pairs). Values in C, D and F are means±s.e.m. Scale bars: 5 µm for DRG images; 10 µm for sciatic nerve images.

