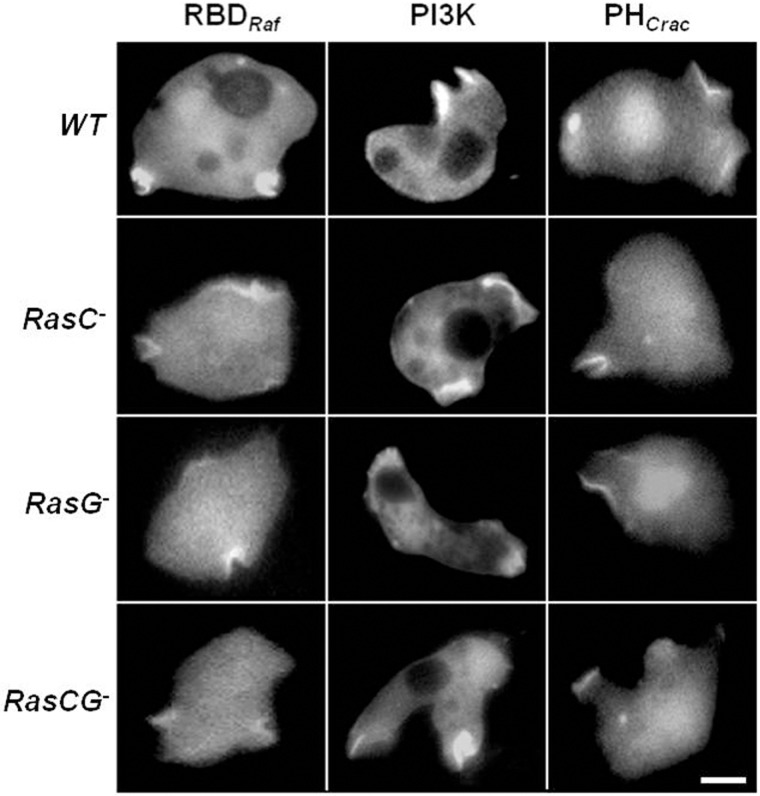
Fig. 3.
Random motility of WT and Ras mutants. The vegetative cells expressing RBDRaf–GFP, PI3K–GFP and PHCrac–GFP were plated in the Na/KPO4 buffer. The fluorescence images were captured in the absence of chemoattractant. All three markers localized to the pseudopods and macropinosomes. Scale bar: ∼5 µm.

