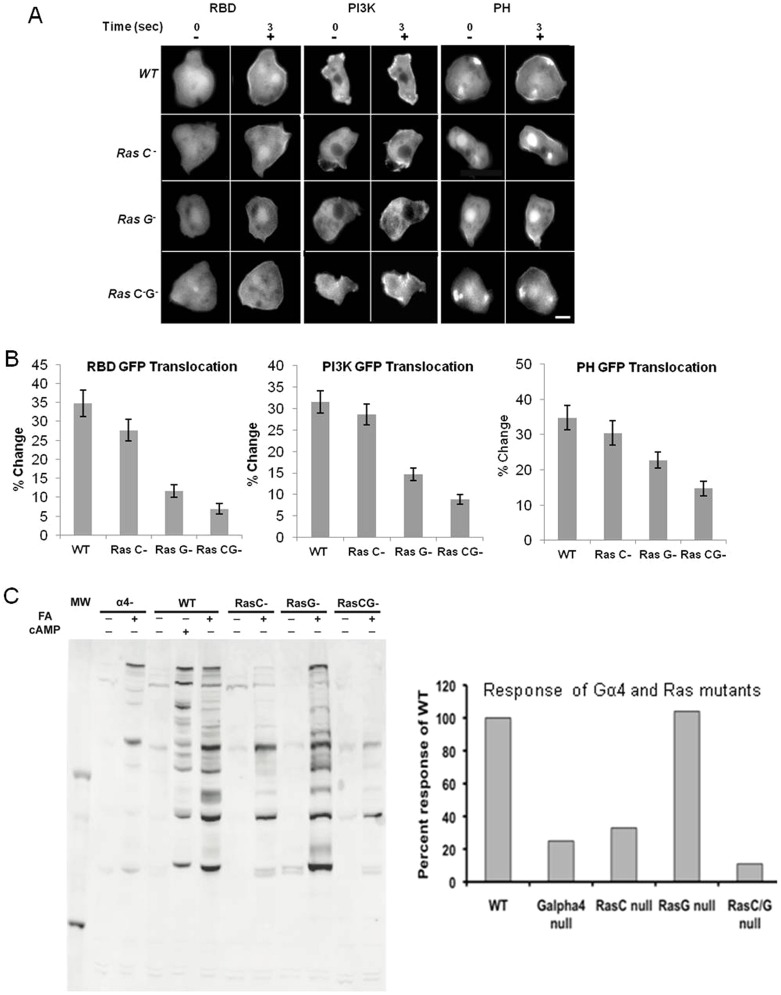
Fig. 4.
Ras and PI3K activity are significantly reduced in Ras G and Ras C/G null cells. (A) Fluorescent images of wild-type and Ras mutants expressing RBDRaf –GFP, PI3K–GFP and PHCrac–GFP. Cells were stimulated with 100 µM FA (+), and the indicated GFP-tagged proteins translocated to the plasma membrane. Scale bar: ∼5 µm. (B) The percentage change of membrane to cytosol ratio is significantly decreased in Ras G and Ras C/G null cells (P<0.05). Error bars show the standard error of mean. (C) Western blot band intensity (left) was quantified using ImageJ and plotted (right) as the percentage change of Ras mutants over the wild type.

