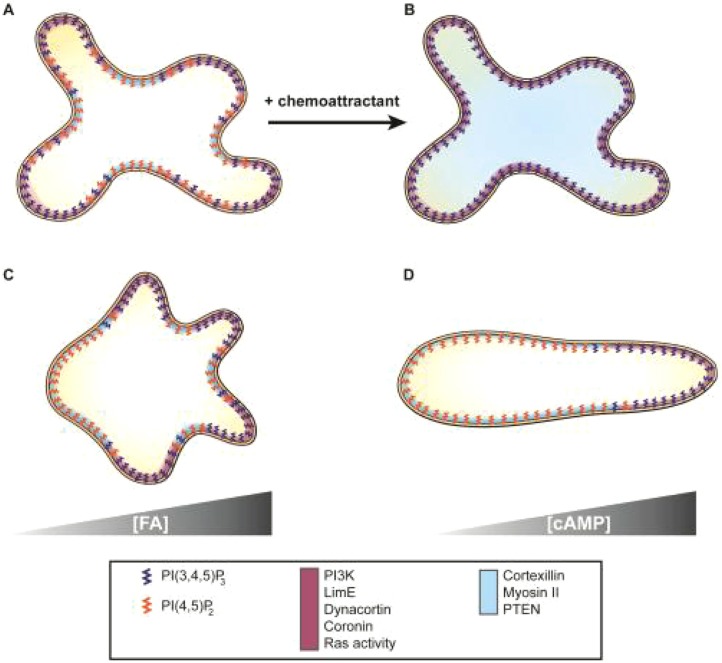
Fig. 8.
Schematic diagram of signaling events. (A) A randomly moving vegetative cell. PtdIns(3,4,5)P3 [PI(3,4,5)P3], PtdIns(4,5)P2 [PI(4,5)P2] and signaling proteins are color coded. Pseudopods are enriched with PtdIns(3,4,5)P3 (dark blue), PI3K, LimE, dynacortin, coronin and Ras activity (maroon signaling and cytoskeletal components). PtdIns(4,5)P2 (orange), cortexillin-1, myosin II and PTEN are localized (light blue) to the membrane areas between the pseudopods. (B) Upon uniform chemoattractant stimulation, PtdIns(4,5)P2 levels decrease and cortexillin-1, myosin II and PTEN delocalize from the membrane and are enriched in the cytoplasm (light blue). In contrast, the other components localize uniformly across the membrane periphery as PtdIns(3,4,5)P3 levels increase. (C) A vegetative cell migrating in a FA gradient. Pseudopods are biased towards the FA source and enriched with PtdIns(3,4,5)P3 and maroon signaling and cytoskeletal components. More PtdIns(4,5)P2, PTEN, cortexillin-1, myosin II and PTEN were found at the plasma membrane away from the FA source. (D) Similar localization was previously observed in polarized cells exposed to a cAMP gradient. PtdIns(3,4,5)P3 localization is based on PHCrac–GFP, while PtdIns(4,5)P2 distribution is based on the localization of PTEN–GFP.

