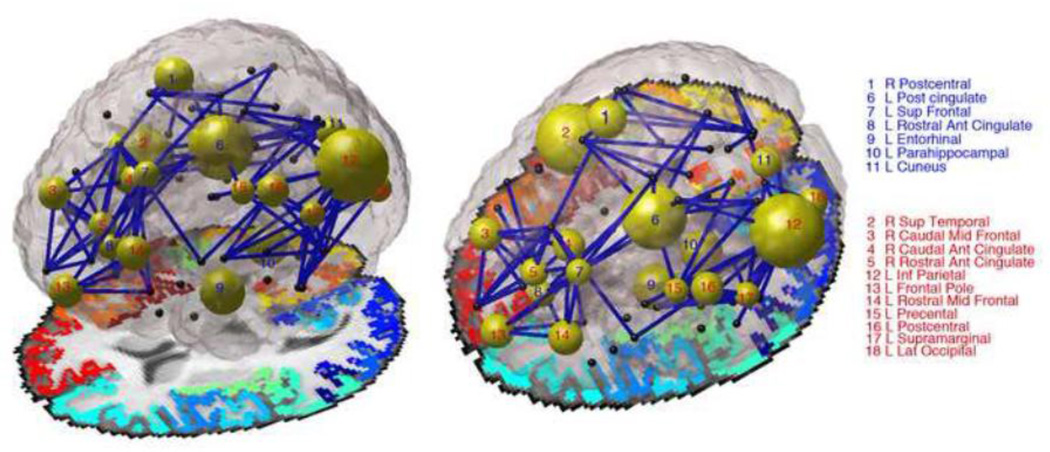
Figure 2. Image depicting developmental effects, comparing children (12 and 16 year olds) to adults (20–30 year olds).
The diameter of each node is inversely proportional to the p-value for the degree analyses – large diameter means node was significantly different in degree between children and adults. Non-significant nodes are colored black. Nodes numbered in blue increase in degree with age, while those numbered with red decrease in degree with age. Blue connections are those that changed with age, corresponding to significant boxes in Figure 3. For this image we looked only at connections present in at least 95% of subjects. Author NJ is the creator of this image.

