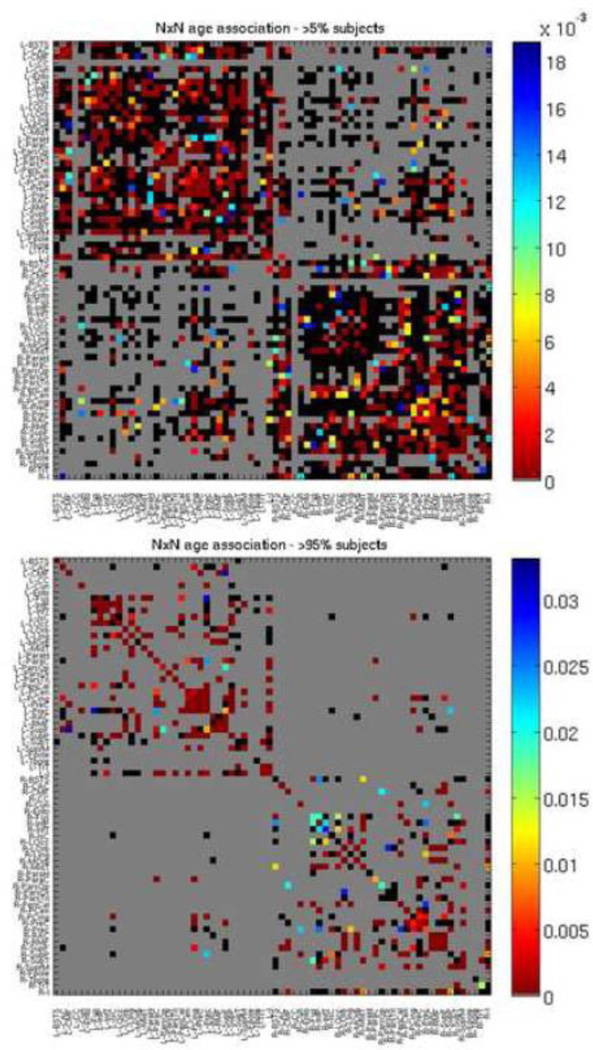
Figure 4. P map of age effects, when modeled alone (Eq. 2), with 70×70 fiber density matrix from which graph theory metrics were calculated.
Colors correspond to strength of p value as indicated by color bar. Gray boxes were not tested as those connections were not present. For the top p map connections that were present in at least 5% of subjects were tested, for the bottom p map, connections that were present in at least 95% of subjects were tested. Black boxes were tested but not significant. FDR corrected (q < 0.05). See Table 6 for region key.

