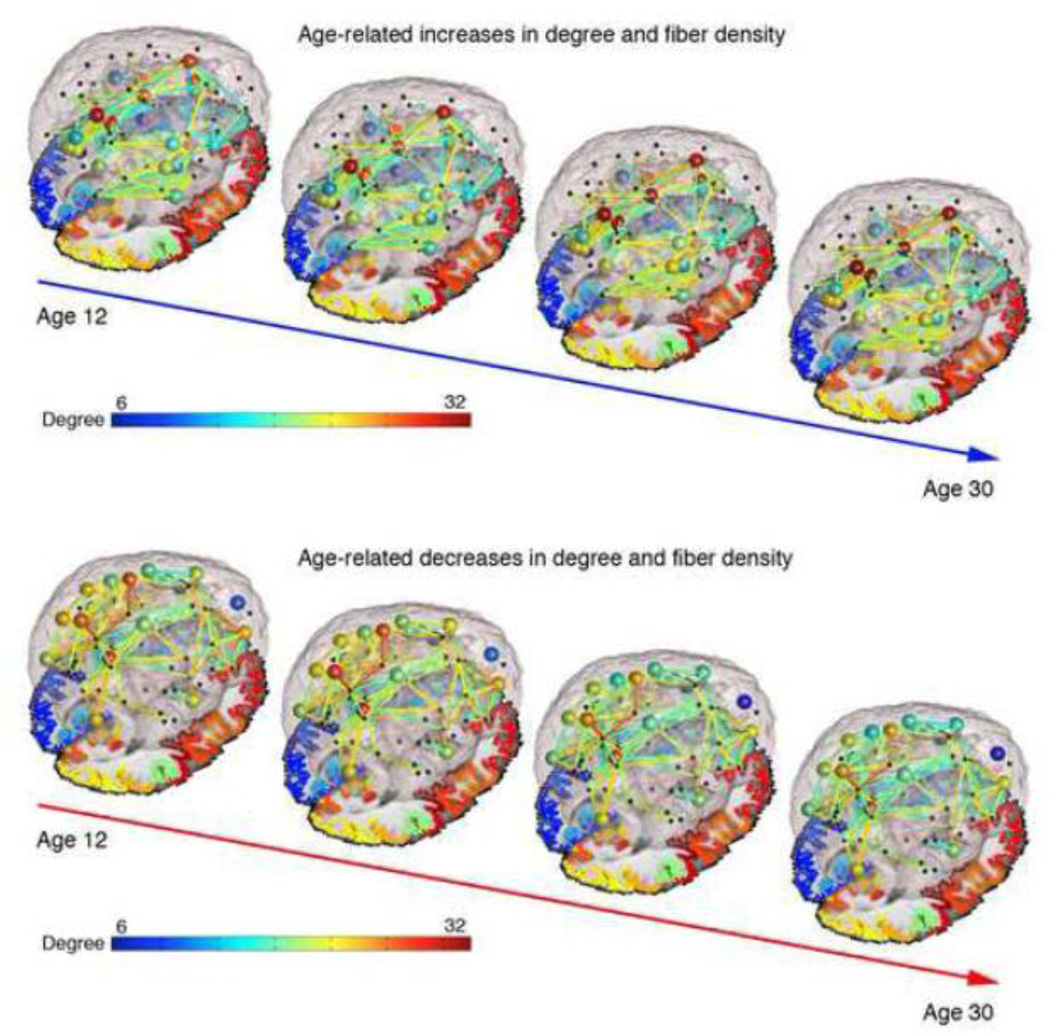
Figure 5. Image depicting developmental trajectory, with averaged networks shown for four groups (12 year olds, 16 year olds, 20–24 year olds, 24–30 year olds).
The color of each connection is proportional to the average fiber density within group with red signifying the thickest connections and blue the thinnest connections; the color of the node is proportional to the average degree of that node within group. For this image we looked only at connections present in at least 95% of subjects. Author NJ is the creator of this image.

