Figure 3.

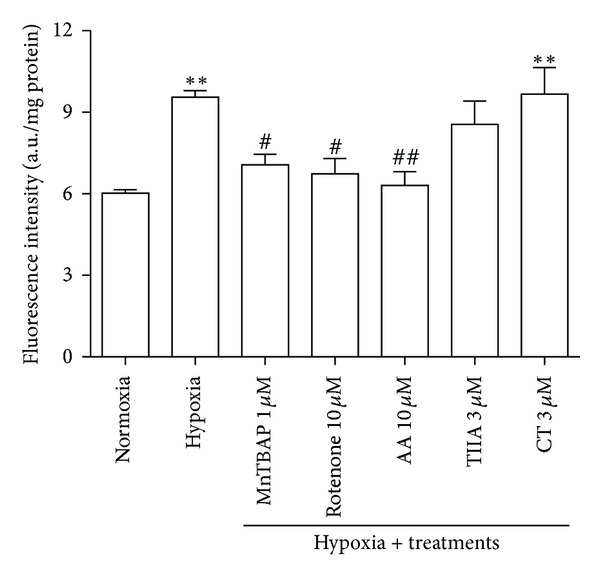
Effects of TIIA and CT on hypoxia-induced increase in H2O2/ONOO− production. Quantitative value of DCFH-DA fluorescence intensity (n = 4). # P < 0.05 versus hypoxia, ## P < 0.01 versus hypoxia, and **P < 0.01 versus normoxia.

Effects of TIIA and CT on hypoxia-induced increase in H2O2/ONOO− production. Quantitative value of DCFH-DA fluorescence intensity (n = 4). # P < 0.05 versus hypoxia, ## P < 0.01 versus hypoxia, and **P < 0.01 versus normoxia.