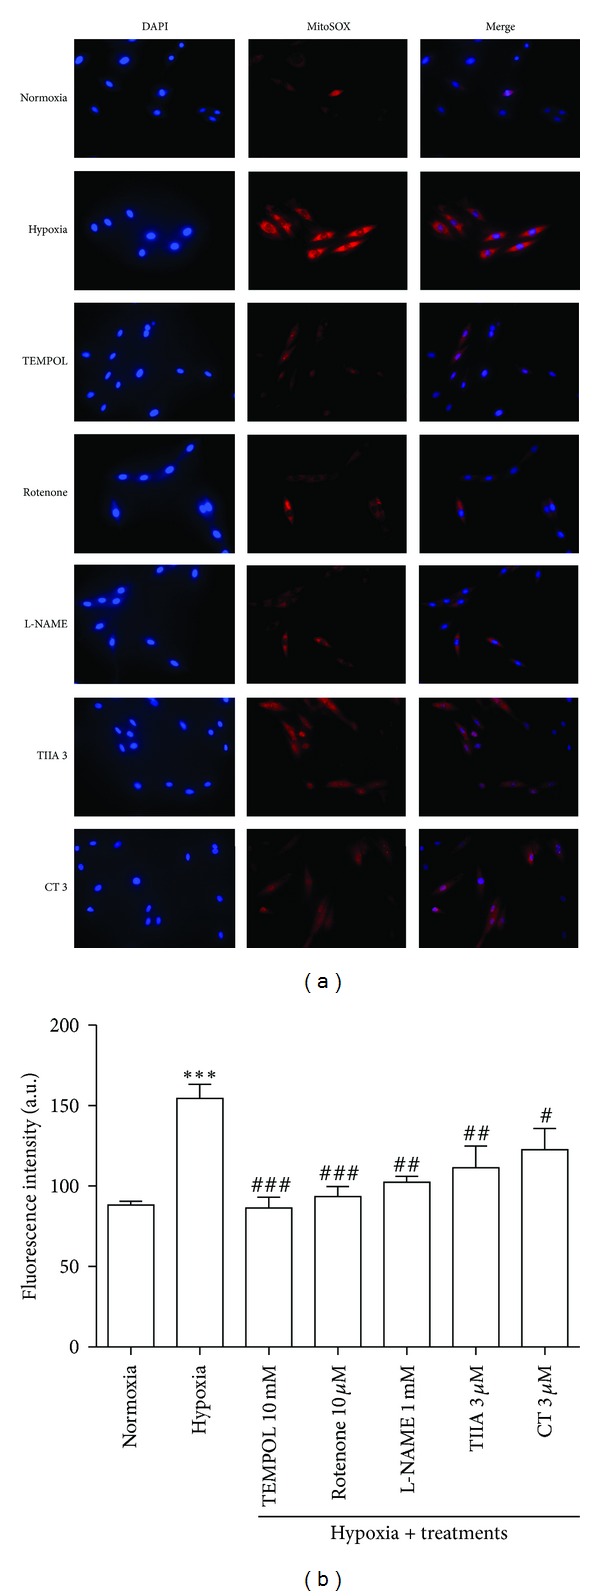
Figure 4.

Effects of TIIA and CT on hypoxia-induced increase in mitochondrial superoxide production. (a) Cell images illustrate MitoSOX (red) and DAPI (blue) in each group. (b) The quantified value of MitoSOX fluorescence intensity. Represented data are mean value of 500 each cells with 5 independent experiments. # P < 0.05 versus hypoxia, ## P < 0.01 versus hypoxia, ### P < 0.001 versus hypoxia, and ***P < 0.001 versus normoxia.
