
Figure 1.
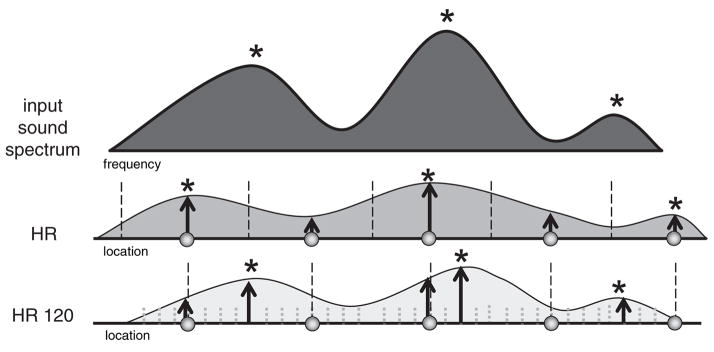
Schematic representation of an input stimulus frequency spectrum and corresponding stimulation with either HR or HR 120.
Official websites use .gov
A
.gov website belongs to an official
government organization in the United States.
Secure .gov websites use HTTPS
A lock (
) or https:// means you've safely
connected to the .gov website. Share sensitive
information only on official, secure websites.
Schematic representation of an input stimulus frequency spectrum and corresponding stimulation with either HR or HR 120.