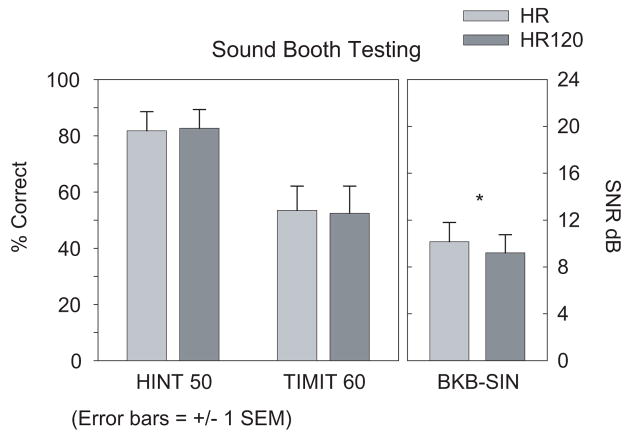
Figure 4.
Group mean scores on the HINT sentence test in quiet (50 dB SPL), TIMIT sentence test in quiet (60 dB SPL), and the BKB-SIN test are shown for subjects when listening with HR (gray bars) and HR 120 (black bars). Speech recognition measures were presented in the sound booth. Error bars represent +/− 1 SE from the mean. Asterisks denote statistically significant differences in scores between strategies (* p < 0.05).

