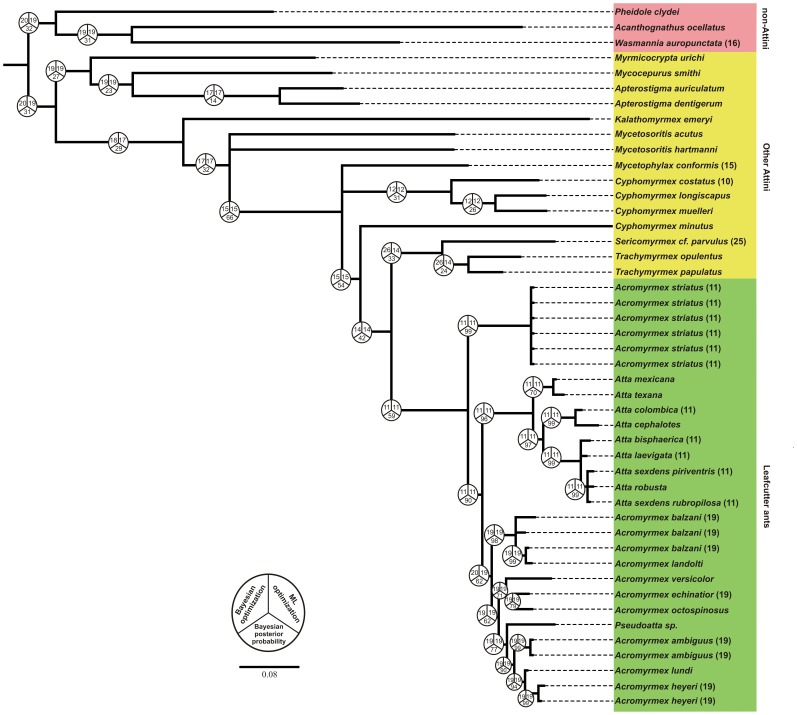
Figure 5. Ancestral haploid chromosome state reconstruction inferred under Bayesian and Maximum Likelihood optimizations, with out-groups (other Attini and non-Attini) included and known chromosome states (tips).
Pie charts at nodes represent the inferred chromosome number in both approaches and its Bayesian posterior probabilities.

