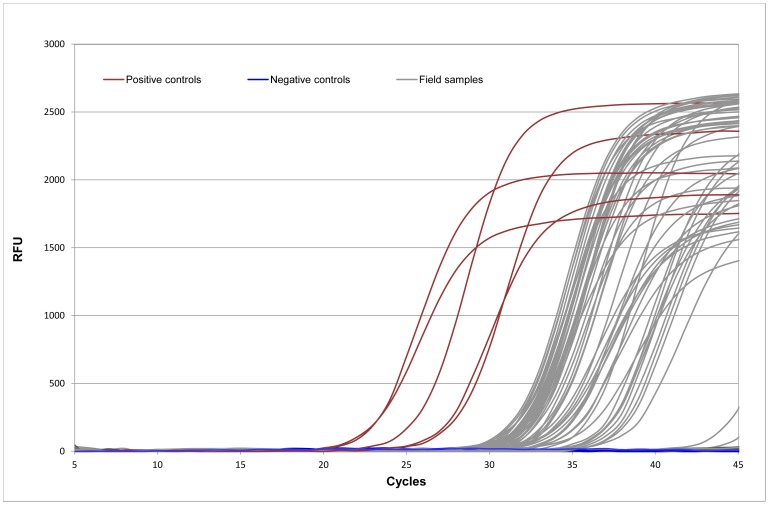
Figure 2. Parvovirus DNA amplification curves obtained during real-time PCR assays with tissue samples from wild carnivores.
The relative fluorescence units (RFU) are plotted against cycle number. Ct variation was observed among positive samples from all surveyed species, with the exception of genet tissues, which yielded homogeneous values below 35. The average Ct was 34.73 cycles (standard deviation of 3.36). Values above 40 were considered negative. The Ct values of the positive controls used in each assay, a commercial vaccine containing the old CPV-2 strain, are also represented. Negative controls had no measurable fluorescence indicated by flat lines in the plot.

