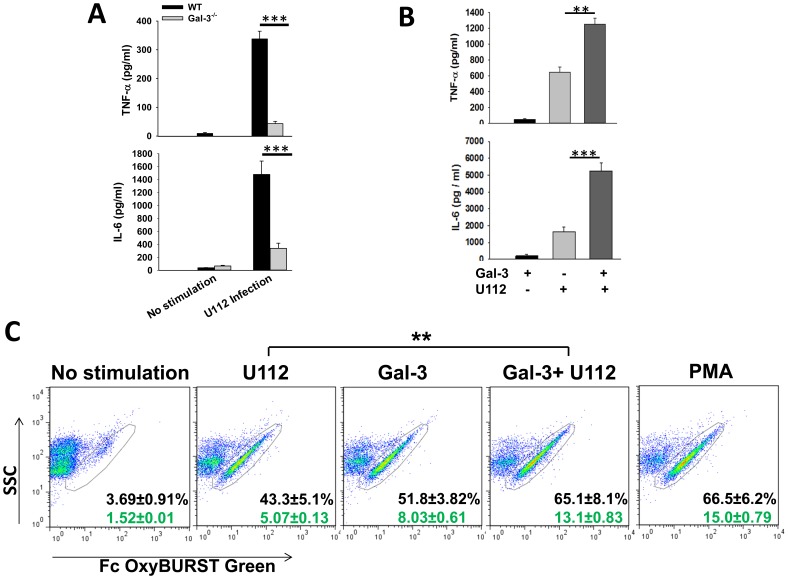
Figure 4. Galectin-3 regulates F.n. infection induced inflammatory response in-vitro.
(A). Bone marrow derived macrophages (BMDMs) were isolated from wild-type and galectin-3−/− mice as described in Methods. The cells were infected with wild-type F.n. Strain U112 at MOI of 50 and the culture supernatents were collected 24 h after infection. The amount of TNF-α and IL-6 were measured in the supernatents by Sandwich ELISA. (B). BMDMs from C57Bl/6 wild-type mice were infected with wild-type F.n. Strain U112 at an MOI of 50 with or without pretreatment with 10 µg/ml of purified recombinant galectin-3. Culture supernatants were collected 24 h after infection and the amount of TNF-α and IL-6 were measured by ELISA. The experiment was repeated three times with similar results. (C). Peritoneal neutrophils were isolated from mice 12–14 h after injection with 4% thioglycollate and were stimulated with F. novicida at an MOI 50 with or without pre-treatment with purified recombinant galectin-3 (10 µg/ml). Stimulation with galectin-3 alone or phorbol myristate acetate (PMA, 10 ng/ml) was used as a control. Production of reactive oxygen species was measured one hour post-stimulation by flow-cytometry using Fc-OxyBURST dye following the manufacturer’s instructions. Numbers in black on the plots depict percent of ROS positive cells and the numbers in green represent median fluorescence intensity (MFI) of individual cells. Dot plots from a representative of 3 independent experiments are shown. Statistical analysis between the data sets was performed by Student’s t test where **p<0.005; ***p<0.001.

