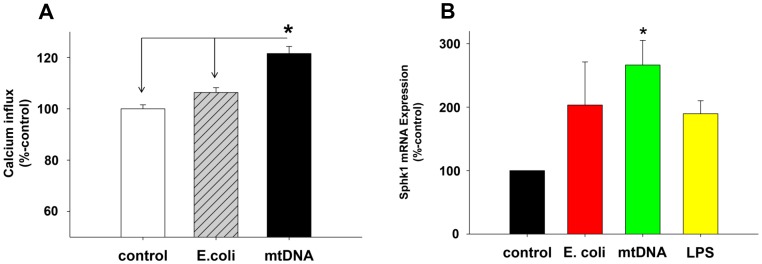
Figure 7. mtDNA increases SOCE and expression of Sphk1 in PMN.
(A) Human PMN were treated with 20 µg/mL of E.coli DNA or mtDNA for 60 min then loaded with fura-2. Thapsigargin (1 µM) was applied to under nominally calcium-free conditions and then 1.8 mM extracellular calcium was applied at the indicated times. Calcium influx was calculated as described elsewhere [9] as the area under the curve for [Ca2+]i (AUC) over 120 sec. Data were analyzed using medium-treated PMN as 100%. Mean and SE values are shown. At least 3 experiment were done per condition. * denotes a significant difference by student t-test (SigmaPlot 11) compared to time “0” value. Experiments were repeated at least three times. (7B) Freshly isolated human PMN (5 million cells in 2 mL) were incubated with medium, mtDNA (10 µg/mL), E.coli DNA (10 µg/mL), or LPS (100 ng/mL) for 60 min. Then RNA and cDNA were prepared using the RNesay mini kit (Qiagen) and SuperScript VILO cDNA Synthesis kit (Life technologies), respectively. 200 ng of cDNA per reaction was used for TaqMan qPCR assay for Sphk1 and GAPDH to evaluate expression levels. Sphk1 expression levels were then further normalized by GAPDH using the medium control result as 100%. Four different PMN preparations were used for stimulation and qPCR assays were done in triplicates. Mean and SE values from four different experiments are shown. Data were analyzed by One Way ANOVA. * denotes a significant difference between mtDNA treatment and the medium control (p<0.05). No other significant differences were found.

