
Figure 2. Schematic for computation model.
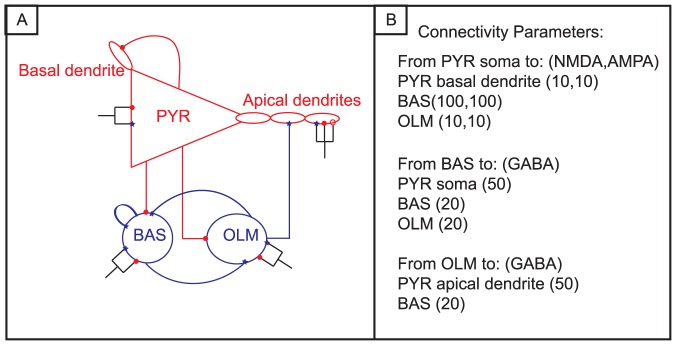
The red triangle represents the population of excitatory pyramidal cells (PYR); blue circles are the inhibitory basket (BAS) cell population and oriens-lacunosum moleculare (OLM) cell population. Cells are randomly connected within each cell population. Truncated lines represent sites in which the synaptic weights were modified: red filled circles-AMPA, red open circles – NMDA and blue filled stars–GABAA. Numbers of AMPA, NMDA and GABA synaptic connections are listed in panel B.