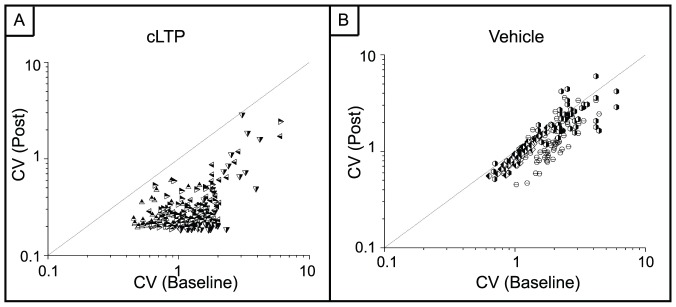
Figure 7. The coefficient of variation (CV) of inter-spike intervals is reduced after chemical LTP.

A) CV from the chemical LTP MEAs. There is an overall reduction in the CV indicating that variability in activity has been reduced. (one-way ANOVA, p<10−5) B) MEAs treated with only DMSO show no change in the CV. (one-way ANOVA, p<10−8) Each symbol corresponds to a different MEA. Three MEAs were used for the vehicle and four MEAs were used for the chemical LTP studies. The diagonal line denotes y = x.
