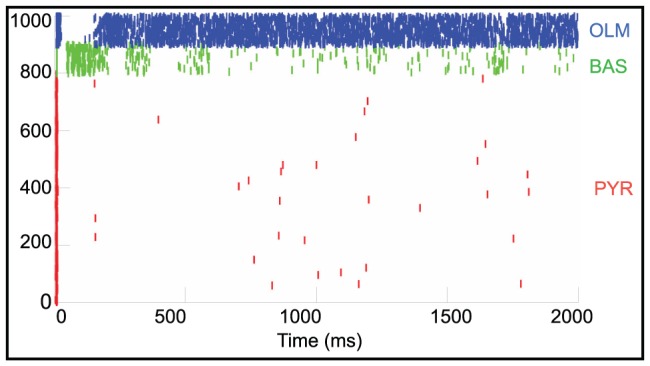
Figure 10. Basal network activity is sparse with only inhibitory OLM cells displaying high frequency spiking activity.

Raster plot of simulated activity in which the red tick marks represents the excitatory pyramidal cells; green tick marks are inhibitory basket (BAS) cells and the blue tick marks are the inhibitory OLM cells.
