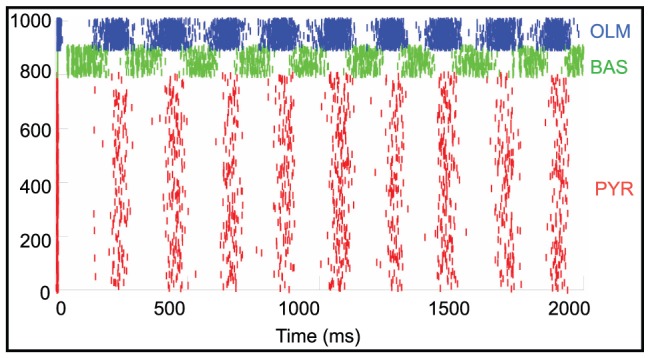
Figure 11. Synchronized bursting activity appears after synaptic weights have been increased.

Raster plot of simulated network activity after AMPA synaptic weights were increased throughout the network. Red tick marks represents the excitatory pyramidal cells; green tick marks are inhibitory basket cells and the blue tick marks are the inhibitory OLM cells.
