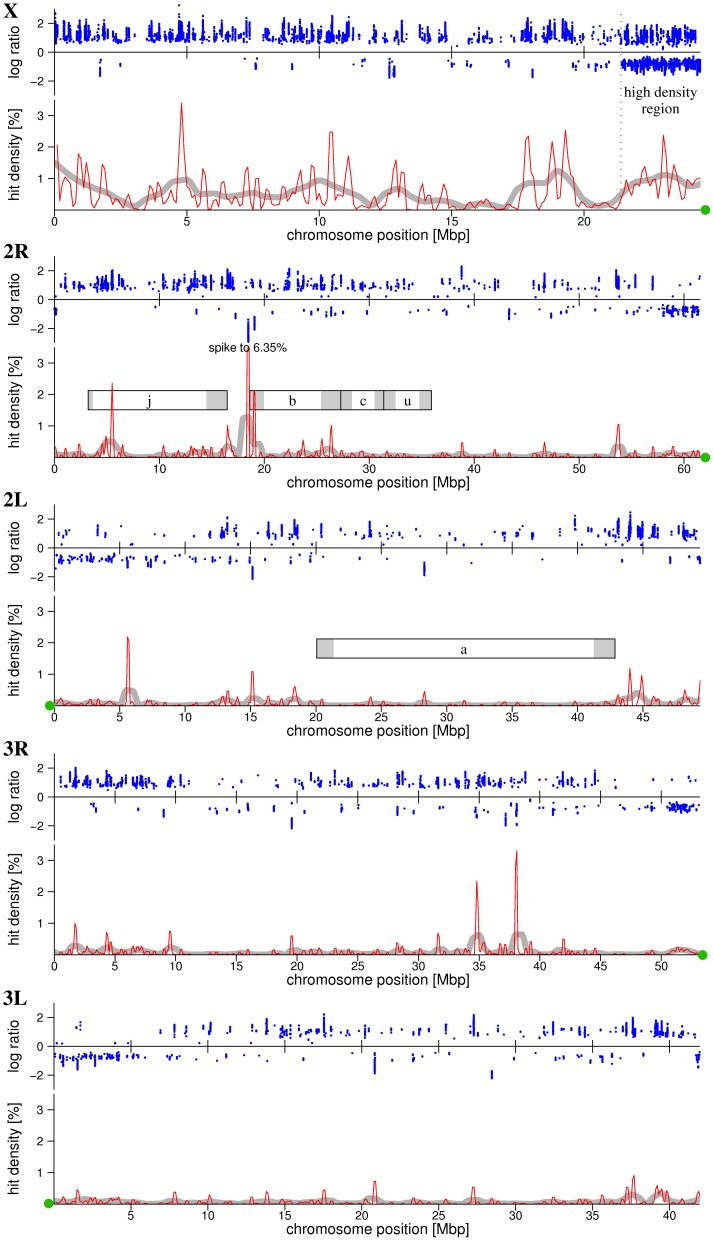
Figure 1. Distribution of divergence on each chromosome.
Fraction of significant probes, denoted “hit density”, using a 200 kbp windows across the X, 2R and 2L chromosomes is indicated by the solid red line. Smooth gray lines indicate the fraction of significant probes in 1 Mbp windows. Positions of inversions (j,b,c,u and a) are depicted as rectangles, with shading indicating the approximate location of inversion breakpoints. Centromere positions are marked as green dots on the X axis. The log-ratio of significant probes is marked with blue dots, log ratios above zero are probes with higher signal intensity in the Bamako relative to Savanna forms, below zero weaker signal intensity. Log-ratio of 1 indicates a two fold increase in hybridization signal intensities in Bamako forms relative to Savanna forms. Log-ratio of −1 indicates a two fold increase in signal intensities in Savanna forms compared to Bamako forms.

