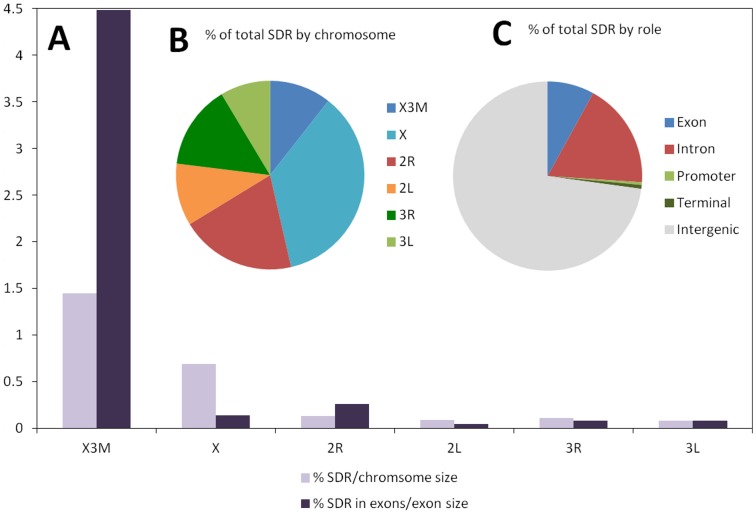
Figure 2. Distribution and characterization of genomic divergence.
A: Proportion (%) of significantly differentiated regions (SDRs) expressed as a percentage of the total chromosome segment size are shown in light colored bars. Proportions of SDRs in exons as a percentage of the total exon size per segment are shown in dark colored bars. The X3M segment includes the 3 Mbp region proximal to the centromere. The X includes the X chromosome minus the X3M region. B: Proportion (%) of total SDR size categorized by chromosome segment. C: Proportion (%) of total SDR size categorized by the role of the nearest gene. An SDR is classified as 'intergenic' if there is no gene located within 250 bp from either end of that SDR.

