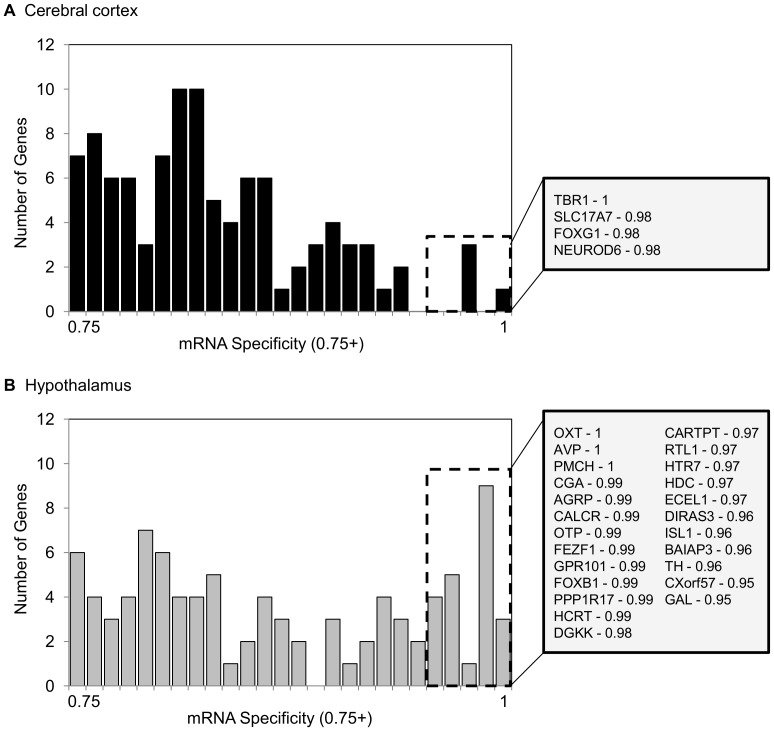
Figure 2. Regional gene expression specificity.
Specificity values ranging from 0.75–1.0 are mapped in histograms for (A) cerebral cortex and (B) hypothalamus. An expression specificity value of 1.0 means that 100% of the reads for that mRNA were found in the indicated region. mRNAs with an expression specificity value of 0.95 or higher are denoted by a dashed box and listed in the gray box to the right of each histogram. The corresponding specificity values are listed after each mRNA. Gene names listed are HGNC designations.

