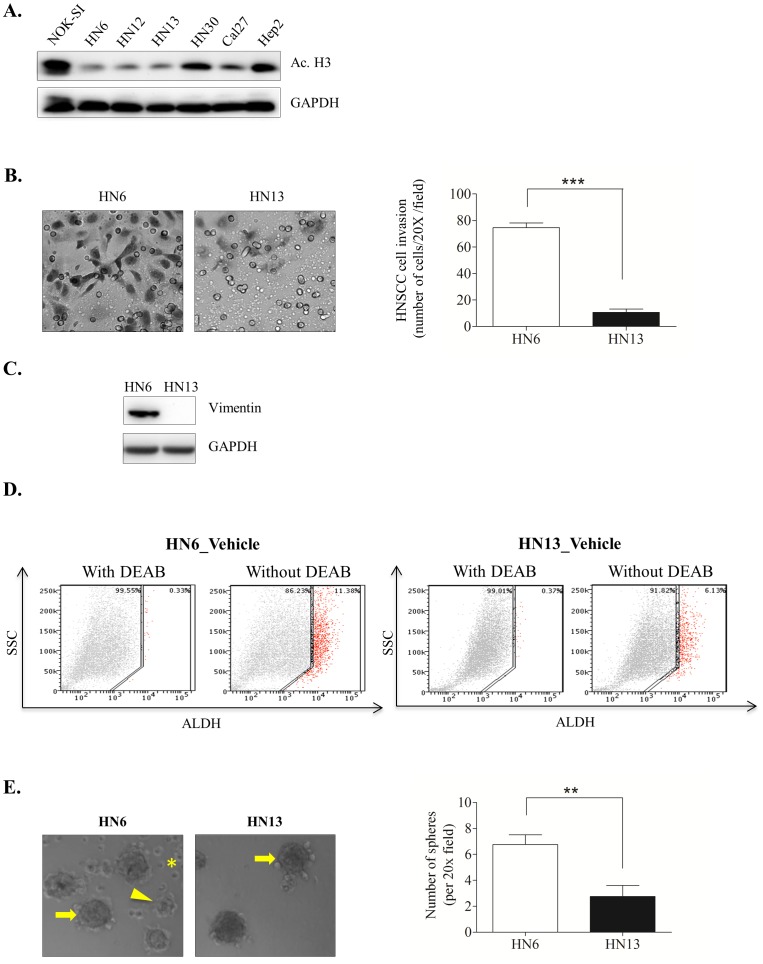
Figure 1. Hypoacetylation of tumor chromatin alone does not predict HNSCC behavior under normal culture conditions.
(A) Western blot analysis showing global chromatin hypoacetylation of HNSCC, as evidenced by low expression levels of Acetyl-Histone H3 Lys9 (Ac.H3) compared to control normal oral keratinocytes (NOK-SI). (B) Representative images and bar graph of invasion assays. HN6 show a significant invasive capacity compared to HN13 (***p<0.001). Invasion was determined by counting HNSCC cells in the bottom of the membrane (see Materials and Methods for details) in multiple fields (20X). (C) Western blot analysis showing high expression levels of endogenous vimentin, a canonical marker of EMT, in HN6 cells but not in HN13 cells. (D) Evaluation of the CSC marker ALDH demonstrates that HN6 have a high number of ALDH+ cells, summing to more than 11% of the total tumor cell population. Approximately 6% of HN13 cells are ALDH+. (E) Representative example of holoclones (arrow), meroclones (arrowhead) and paraclones (asterisk) formed during the HN6 clonogenic assay. HN13 tumor cells primarily form undifferentiated holoclones (arrow). Quantification of spheres reveals increased ability of HN6 cell to generate spheres compared to HN13 (**p<0.01).

