
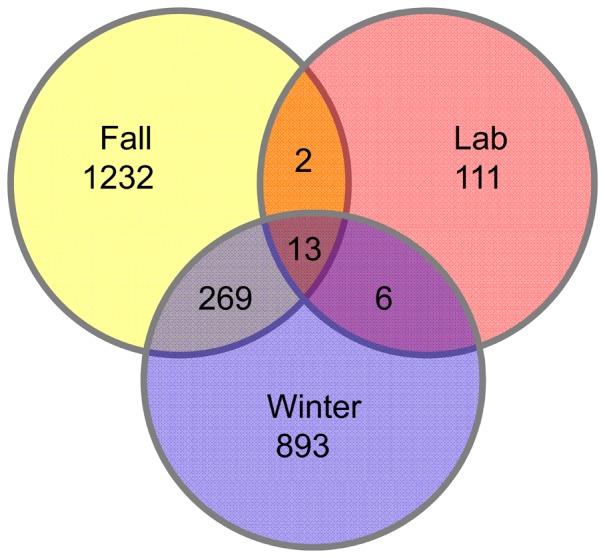
Figure 7. Venn diagram showing the number of OTUs (0.03 distance) that are shared between and among groups; for example, 13 bacterial OTUs are shared by at least one blade in all three groups (fall, winter, laboratory).
Official websites use .gov
A
.gov website belongs to an official
government organization in the United States.
Secure .gov websites use HTTPS
A lock (
) or https:// means you've safely
connected to the .gov website. Share sensitive
information only on official, secure websites.