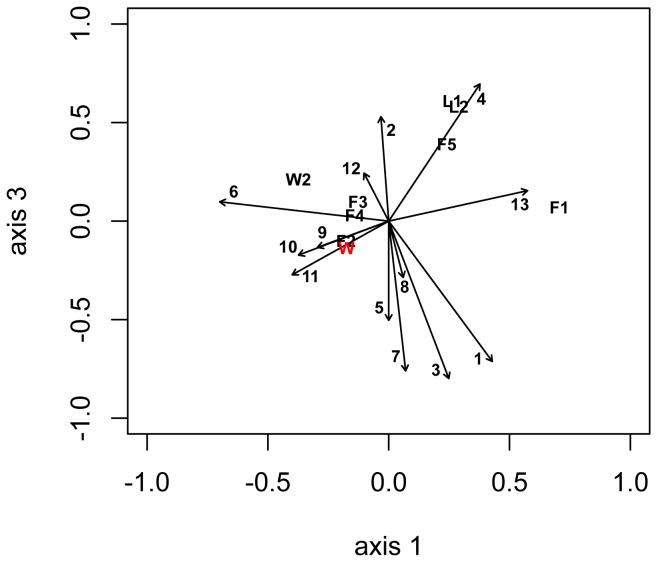
Figure 8. Biplot of all blade samples in a nmds ordination (here showing an axis1-axis 3 plot) with blade OTUs that belong to the core microbiome described from the V8 library.
Vectors pointing toward “axis 3” are associated with winter samples; vectors pointing toward the bottom “axis 1” label are associated with fall samples, and vectors pointing away from the “axis 1” label are associated with laboratory samples. The OTU's length indicates the strength of the association, and the direction indicates the direction of the effect; the relative positions of each sample (n = 12) are plotted in the biplot. Numbers for OTUs in the figure correspond to OTU reference numbers as follows and 9 OTUs are significantly associated with an axis at p<0.05: 1 = OTU 1982; 2 = OTU 2387; 3 = OTU 2410; 4 = OTU 2427; 5 = OTU 2434; 6 = OTU 2521; 7 = OTU 2525; 8 = OTU 2493(NS); 9 = OTU 2408; 10 = OTU 1933(NS); 11 = OTU 2219(NS); 12 = OTU 2494(NS); 13 = OTU 2225; for taxonomic classification see Table 4; also see Table S9 for significantly associated OTUs.

