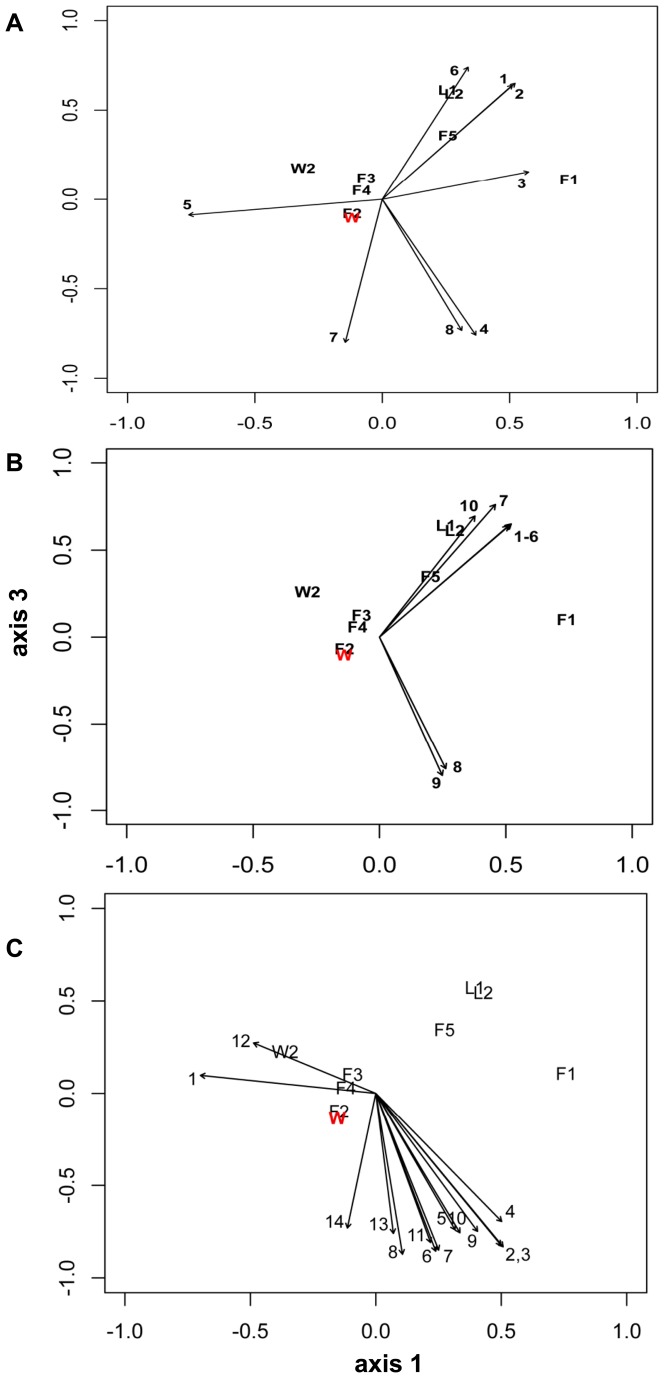
Figure 9. Biplots of OTUs which represent subsets of all (n = 67) of the OTUs that have significant association (p<0.05) with one of the nmds axes.
These OTUs belong to Alphaproteobacteria (Fig. 9A), Flavobacteriaceae (Fig. 9B) and Saprospiraceae (Fig. 9C). The OTU's length indicates the strength of the association, and its direction indicates the direction of the effect; the relative positions of each sample (n = 12) are plotted in the biplot (see Table S9 and Fig. S2 for additional information on the OTUs plotted in each panel, which are decoded as follows: Fig. 9A (Alphaproteobacteria): 1 = OTU 1348, 2 = OTU 1318, 3 = OTU 2225; 4 = OTU 984; 5 = OTU 2178; 6 = OTU 1938; 7 = OTU 1763; 8 = OTU 2394; Fig. 9B (Flavobacteriaceae [Bacteroidetes]): 1 = OTU 1305, 2 = OTU 1322, 3 = OTU 1308, 4 = OTU 1328, 5 = OTU 1297, 6 = OTU 1991, 7 = OTU 2367, 8 = OTU 2071, 9 = OTU 2410; 10 = OTU 2427. Fig. 9C (Saprospiraceae [Bacteroidetes]): 1 = OTU 2521, 2 = OTU 994, 3 = OTU 1196, 4 = OTU 1150, 5 = OTU 1723, 6 = OTU 2426, 7 = OTU 1442, 8 = OTU 2302 (Lewinella), 9 = OTU 1001 (Lewinella), 10 = OTU 1558 (Lewinella), 11 = OTU 844, 12 = OTU 2332, 13 = OTU 2525, 14 = OTU 1674 (Lewinella).

