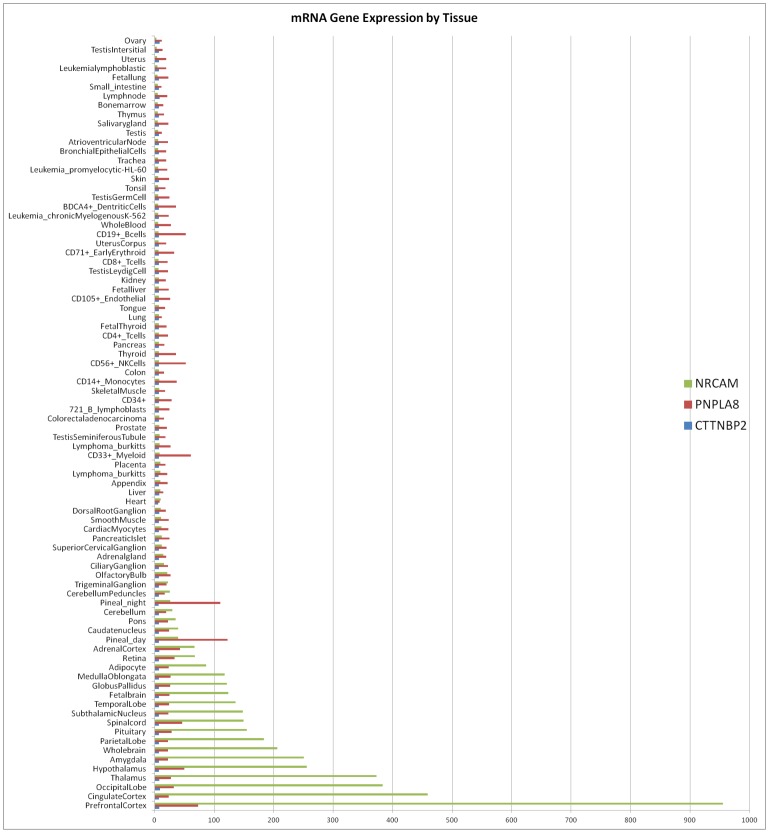
Figure 2. mRNA expression levels of NRCAM, PNPLA8, CTTNBP2.
Graph created using data from www.biogps.org (accessed 7/18/2012) for mRNA expression levels of the gene’s mRNA expression across 84 mouse and humans tissues. While few gene expression across multiple tissues have been done in bovine, it is logical to expect a similar expression pattern as shown above given the high gene exon homology of PNPLA8, CTTNBP2, and NRCAM between bovine, mouse, human, and other mammalian species (ENSEMBL).

