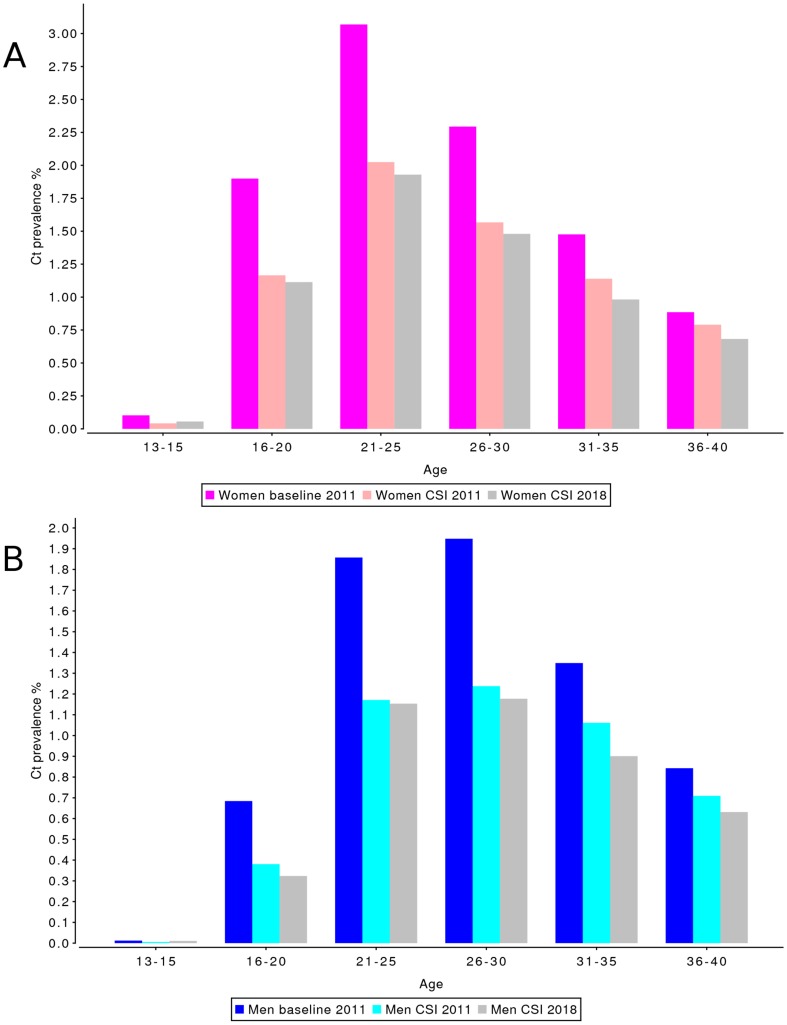
Figure 3. Effect of CSI on population prevalence of Chlamydia infections by age category, on the national level.
Prevalence levels are shown for a scenario without screening implementation (“baseline 2011”), and after 3 (“CSI 2011”) and 10 years (“CSI 2018”) of screening, for (A) women and (B) men. Splitting the population into age-groups gives a detailed view on the effect of CSI screening in addition to baseline testing and treatment at GPs and STD clinics.

