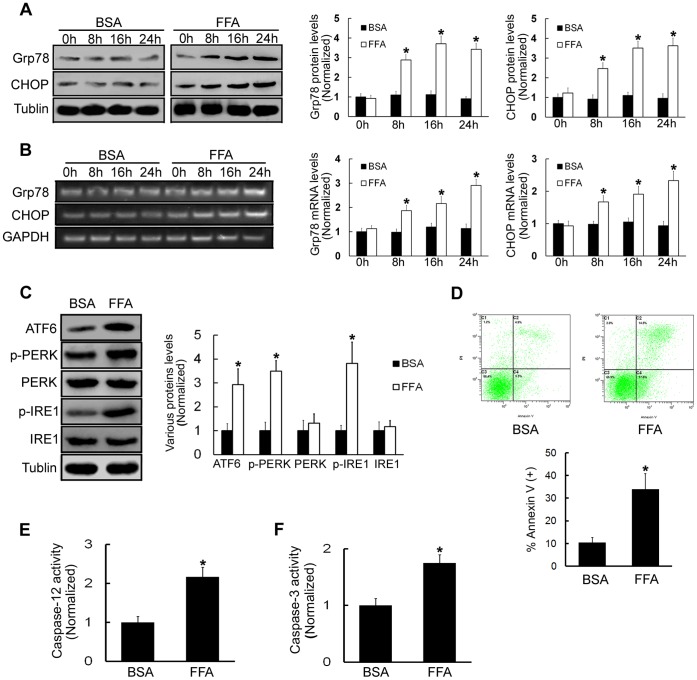
Figure 1. FFA treatments induce ERS in β-TC3 cells and increase cell apoptosis.
(A) Cells were treated with 0.5 mM FFA or BSA for 0, 8, 16, or 24 h. Western blot was used to examine Grp78 and CHOP protein levels. (B) RT-PCR was used to test Grp78 and CHOP mRNA levels. (C) Cells were treated with 0.5 mM FFA or BSA for 16 h. Western blot was used to examine the expression levels of ATF6, p-PERK, PERK, p-IRE1 and IRE1. (D) Cells were treated with 0.5 mM FFA or BSA for 16 h. Cell death was quantified by annexin V/PI double staining. (E) Caspase-12 activity was detected after cells were treated with 0.5 mM FFA or BSA for 16 h. (F) Caspase-3 activity was detected after cells were treated with 0.5 mM FFA or BSA for 16 h. BSA-treated cells were used as a negative control. Bars represent each sample performed in triplicate, and the error bars represent the standard deviations. *P<0.05, by the Student’s t-test.

