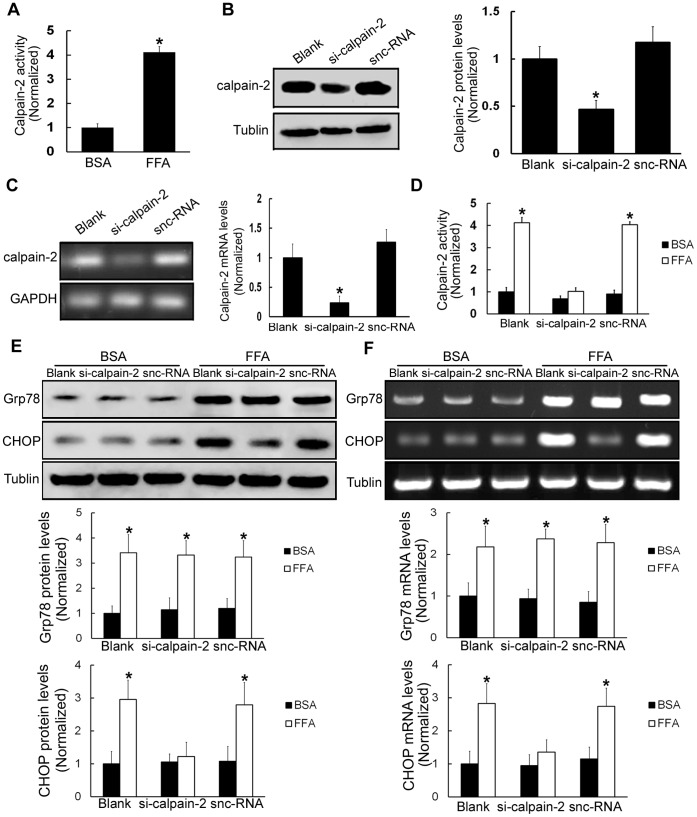
Figure 3. FFA treatments increase calpain-2 activity, thus inducing ERS in β-TC3 cells.
(A) The activity of calpain-2 was tested in β-TC3 cells treated with 0.5 mM FFA or BSA for 16 h. (B) β-TC3 cells were treated with calpain-2 siRNA for 24 h. Western blot was performed to examine calpain-2 protein levels. (C) RT-PCR was used to analyze calpain-2 mRNA levels. (D) Calpain Activity Assay Kit was used to analyze calpain-2 activity. Silencer negative control siRNA (snc-RNA)-treated cells were used as a negative control. (E) β-TC3 cells were treated with calpain-2 siRNA for 24 h and then stimulated with FFA for 16 h, and western blot was used to examine the protein expression levels of Grp78 and CHOP. (F) RT-PCR was used to test Grp78 and CHOP mRNA levels. BSA-treated β-TC3 cells were used as a negative control. Bars represent each sample performed in triplicate, and the error bars represent the standard deviations. *P<0.05, by the Student’s t-test.

