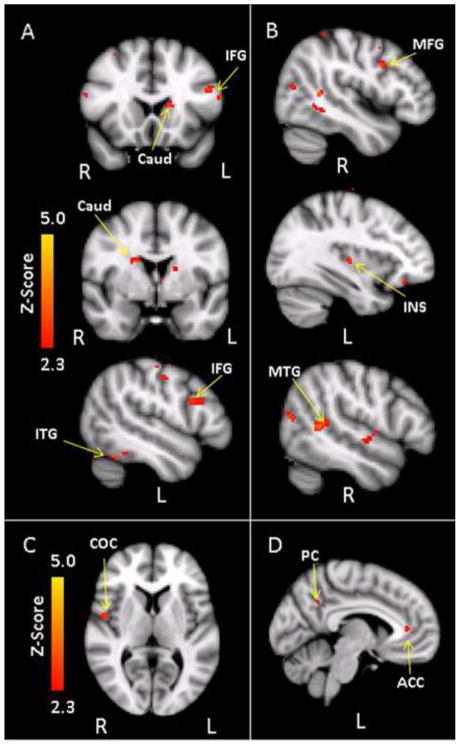
Figure 1.
(A) Areas where the familial high risk group (n=21) showed greater activation than controls (n=21) during target processing. CAUD = Caudate; IFG = Inferior frontal gyrus; ITG = Inferior temporal gyrus. (B) Areas where controls showed greater activation than the familial high risk group during target processing. INS = Insula; MFG = Middle frontal gyrus; MTG = Middle temporal gyrus. (C) Areas where the familial high risk group activated more than controls during the Aversive > Neutral contrast. COC = Central opercular cortex. (D) Areas where the controls activated more than the familial high risk group during the Aversive > Neutral contrast. ACC = Anterior cingulate cortex; PC = Precuneus.

