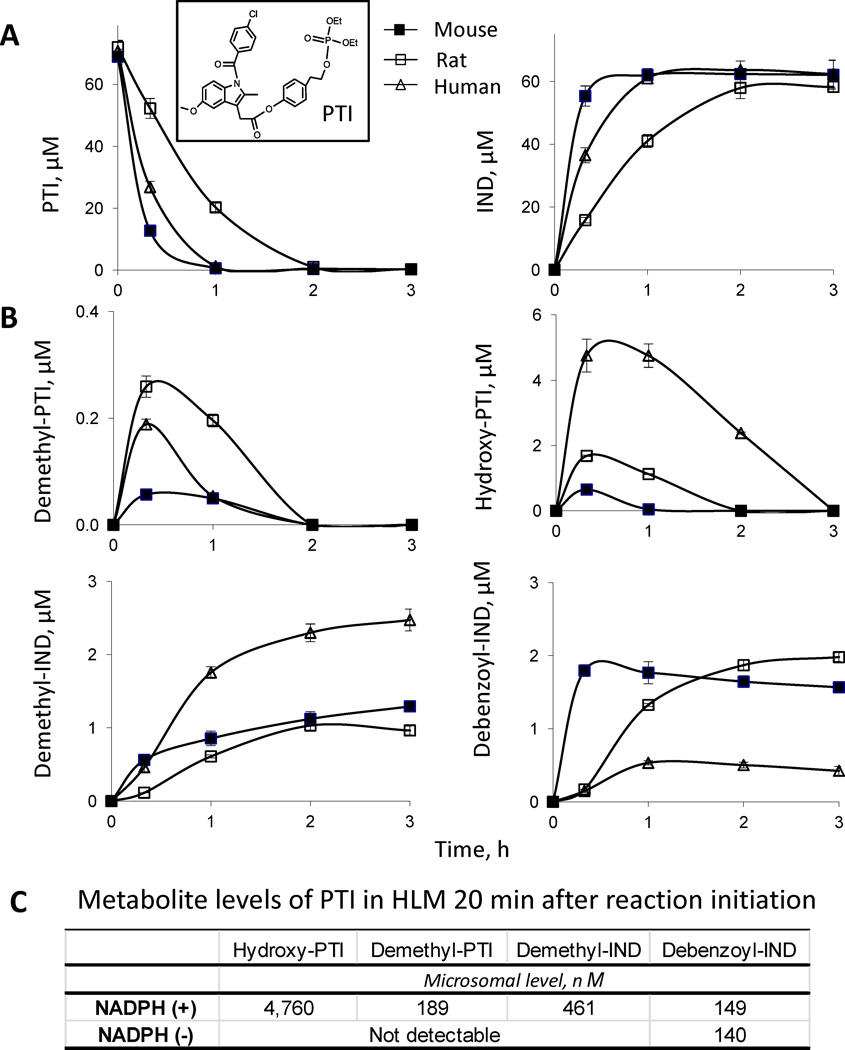
Fig. 1. Kinetics of PTI metabolism by mouse, rat and human liver microsomes.
A: Time courses of the levels of PTI and IND in PTI-treated liver microsomes. PTI (75 µM) was incubated with mouse, rat and human liver microsomes (protein concentration 0.5 mg/ml) at 37°C for up to 3 h. PTI and its metabolites were extracted at the designated time points and assayed using HPLC. Inset, the structure of PTI. B: Time course of metabolite formation in PTI-treated liver microsomes. C: Comparison of metabolite formation in PTI-treated HLMs in the presence (+) versus absence (−) of NADPH, 20 min after the initiation of the reaction.

