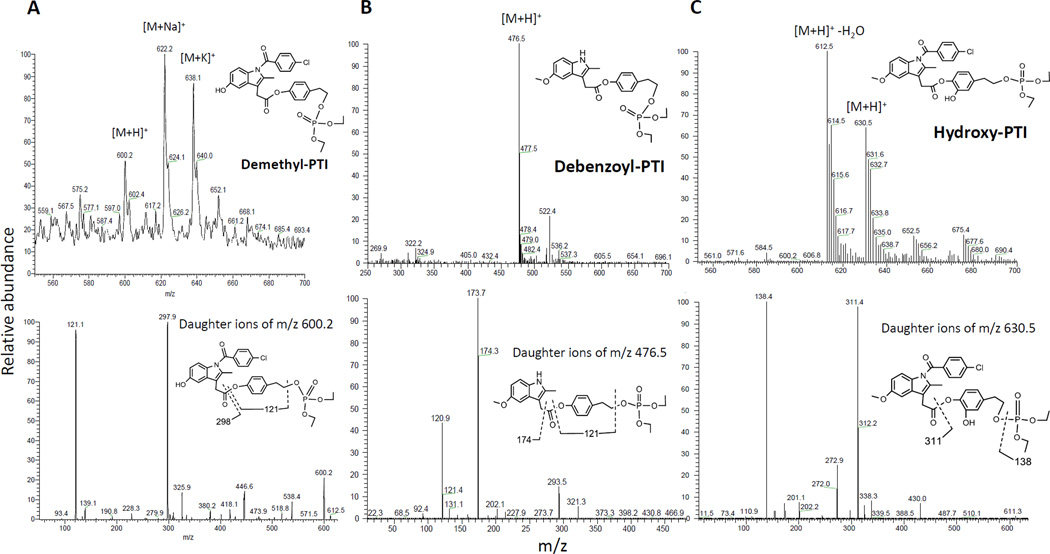
Fig. 2. Identification of the microsomal metabolites of PTI using LC-MS/MS analysis.
MS (top) and MS2 (bottom) ion spectra were shown. A: Top, the protonated demethyl-PTI was observed at m/z 600.2. Bottom, the ion above was fragmented to generate ions at m/z 121.1 and 297.9. B: Top, the protonated debenzoyl-PTI was observed at m/z 476.5. Bottom, the ion above was fragmented to generate ions at m/z 120.9 and 173.7 C: Top, the protonated hydroxy-PTI was observed at m/z 630.5. Bottom, the ion above was fragmented to generate ions at m/z 138.4 and 311.4.

