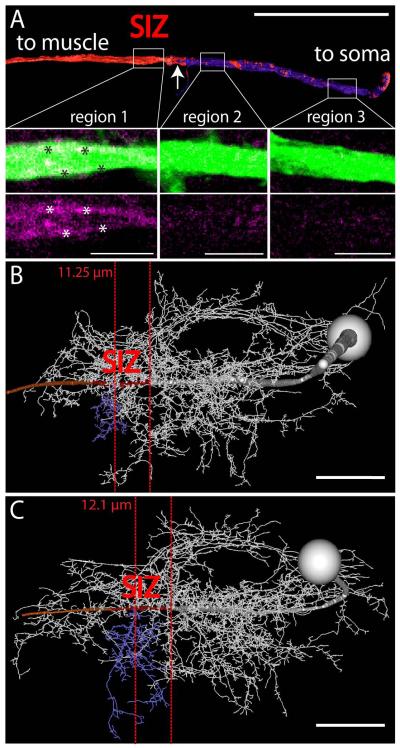
Figure 4. Estimating the location of the putative spike initiating zone of MN5.
(A) shows a surface reconstruction of MN5 primary neurite. MN5 soma is to the right and the axon is to the left. White rectangles demark three regions for which single optical sections of original MN5 staining and immunocytochemistry data for VGSCs are shown as selective enlargements in lower panels. Regions 3 (right) and 2 (middle) show faint immunopositive signal for VGSCs evenly distributed through the primary neurite of MN5. Region 1 (left) shows higher intensity immunolabel for VGSCs in MN5 primary neurite, and most of this signal seems to be confined to the membrane of MN5 primary neurite (white asterisks). VGSC staining intensities are depicted as heat map (low intensities are dark blue and high ones are red) on the surface reconstruction of the MN5 primary neurite. A sharp border between low and high staining intensities for VGSCs is found at about 100 μm from the soma of MN5. (B, C) Same procedure as in (A) for two complete geometric reconstructions of MN5. Primary neurite regions with high labeling intensities for VGSCs are in red, most distal posterior dendrite originating from MN5 primary neurite is in blue. In (B) the sharp border between low and high labeling intensities for VGSCs is located 11.25 μm around the origin of the blue dendrite, and in (C) it is located 12.1 μm around the origin of the blue dendrite. Scale bars: 4 μm in A, 50 μm in B and C.

