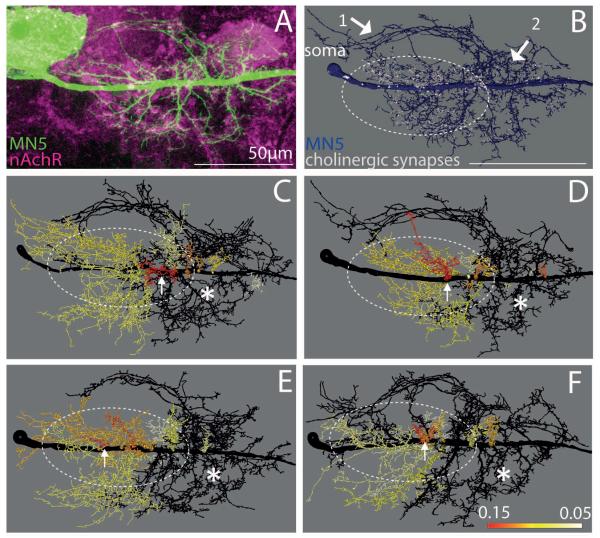
Figure 5. Distribution of putative cholinergic inputs to the Dα7 nAChR through MN5 dendrites.
(A) Representative projection view of intracellular staining of MN5 (green) and GFP-tagged Dα7 receptors following expression of Dα7-GFP under the control of P103.3-GAL4. (B) Mapping of Dα7-GFP puncta (white) that are co-localized with MN5 dendrites and within 300 nm of NC82 puncta (see methods) onto the surface reconstruction of MN5 (blue). (C to F) Heat color map ranks all dendritic sub-trees that contain 75% of all putative cholinergic inputs to MN5. Dotted white oval demarks area that contains ≥ 75 % of all positively scored Dα7-GFP puncta. All black dendrites together receive less than 25 % of all cholinergic inputs. Sub-trees with higher proportions of cholinergic inputs were color coded according to their proportion of putative cholinergic inputs (red sub-tree receives 15 % of all cholinergic inputs, orange 11%, yellow 7%, white < 5%). White arrow demarks dendritic sub-tree (red) with highest density of putative cholinergic inputs. White asterisks demark region mostly devoid of any Dα7-GFP puncta. Scale bar: 70 μm.

