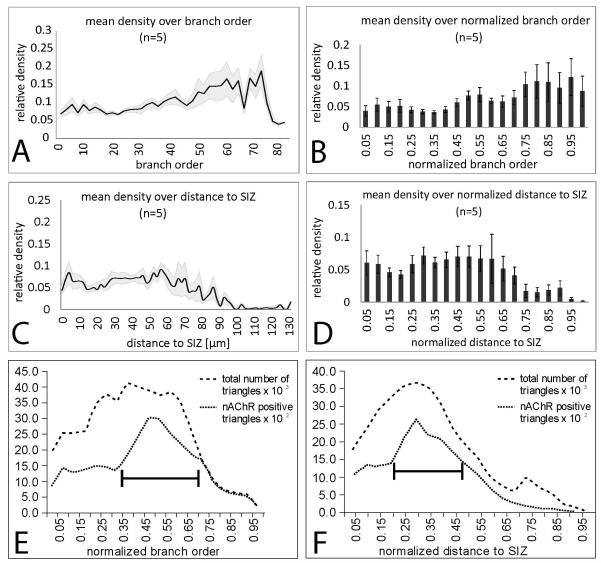
Figure 6. Quantification of distribution of putative cholinergic inputs through MN5 dendrites.
(A) Mean density (black line) and standard error (gray shaded area) of positively scored Dα7-GFP puncta on MN5 dendrites over branch order. For branch order definition the putative SIZ was defined as tree origin. (B) Mean density of positively scored Dα7-GFP puncta on MN5 dendrites over normalized branch order. Normalization was done with respect to highest order branch in each animal. (C) Mean density (black line) and standard error (gray shaded area) of positively scored Dα7-GFP puncta on MN5 dendrites over absolute dendritic distance from the putative SIZ. (D) Mean density of positively scored Dα7-GFP puncta on MN5 dendrites over normalized dendritic distance to putative SIZ. Normalization was conducted relative to the largest distance present in each reconstruction. (E) Total numbers of dendritic surface triangles (dashed line) and dendritic surface triangles that were scored positive for putative cholinergic input over normalized branch order. Black bar demarks normalized branch orders with highest area of positively scored dendritic surface. (F) Total numbers of dendritic surface triangles (dashed line) and dendritic surface triangles that were scored positive for putative cholinergic input over normalized dendritic distance to the spike initiating zone. Black bar demarks normalized distances with highest area of positively scored surface dendritic.

