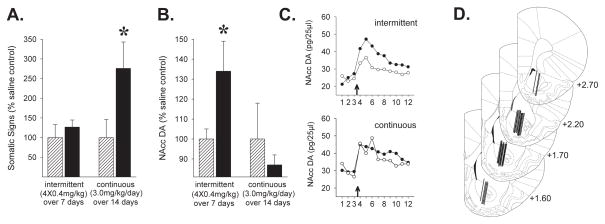
Figure 3.
Evoked somatic signs of withdrawal (A) and maximal nicotine-evoked NAcc DA overflow (B) following an intermittent (4 × 0.4mg/kg, i.p. over 7 days) or continuous (3.0 mg/kg/day, s.c. over 14 days) nicotine exposure regimen (▬). Compared to saline exposed controls (
 ), evoked withdrawal signs were elevated 1-day following continuous but not intermittent nicotine. Nicotine-induced NAcc DA overflow was enhanced 1-day following intermittent but not continuous nicotine. n/group=5–11. Data (mean±SEMs) are expressed as % of saline-exposed controls. Values for the saline control groups were 4.5±2.1 (continuous) and 6.0±1.78 (intermittent) for number of somatic signs and 54.8±10.6 pg/25μl (continuous) and 38.5±1.7 pg/25μl (intermittent) for maximal nicotine-evoked NAcc DA overflow. No significant differences between control groups were observed for either somatic signs (t(10)=0.54, NS) or NAcc DA (t(17)=1.29, NS). *, p<0.05, compared to respective saline exposure controls. C. Time course for DA levels (pg/25μl) in the NAcc before and after the nicotine challenge injection (arrows at abscissae) for both exposure conditions. Numbers at abscissae indicate 20-min sampling intervals. ●, nicotine exposed; ○, saline exposed. D. Line drawings (Paxinos & Watson, 1997; numbers indicate mm from bregma) illustrating the location of the active portion of the microdialysis probes in the NAcc of rats included in the data analyses.

