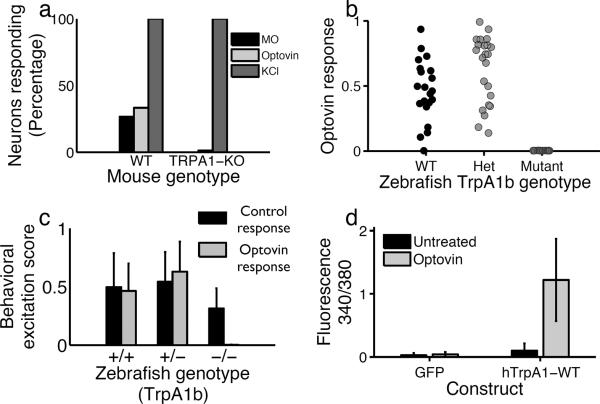
Figure 3. TRPA1 is necessary and sufficient for the optovin response.
(a) Percentage of mouse DRG neurons responding to the indicated treatments. In wild type, the light stimulus activated 30% of neurons assayed (35/105). In the TRPA1-KO neurons, the total percentage of responding neurons was 2.7% (8/291). (b) Behavioral excitation scores during the optovin response for zebrafish of the indicated genotypes. (c) Behavioral excitation scores calculated for WT, heterozygous and homozygous TrpA1b mutant animals (n=21, 23 and 16 respectively) during the PMR (control) and optovin response assays. Homozygous mutant animals show a significantly lower activity during the optovin response assay, p<0.001. (d) Bar plot showing calcium indicator dye fluorescence in cells transfected with GFP or hTrpA1 before and after a 2 min treatment with optovin and light (n=130, 120 cells). The difference between treated and untreated hTRPA1 transfected cells is significant, p<0.001.

