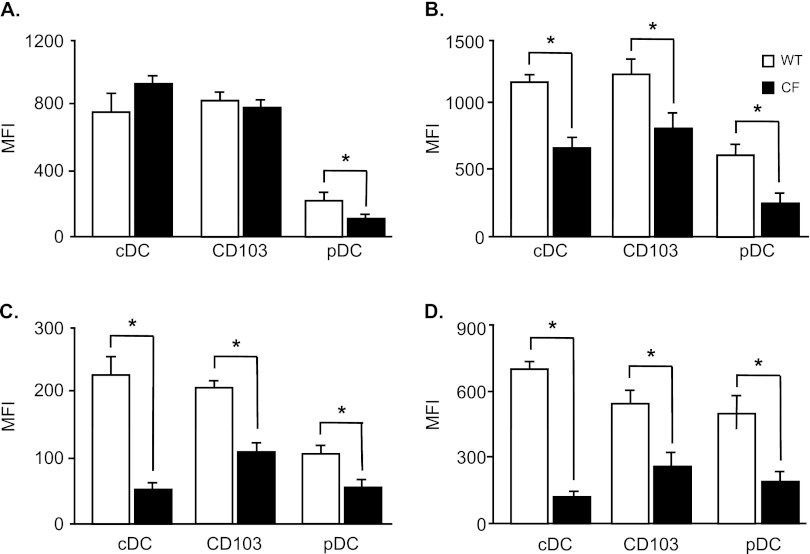
Figure 2.
Impaired activation and maturation of DCs from CF mice. The cDCs, pDCs, and CD103+ DCs from CF and WT mice were analyzed for their surface expression of MHCI (A), MHCII (B), CD40 (C), and CD86 (D) by flow cytometry. Data represent the means ± SEMs of mean fluorescence intensity (MFI) from six independent experiments, each with n = 4–5 mice/group.*P < 0.05.

