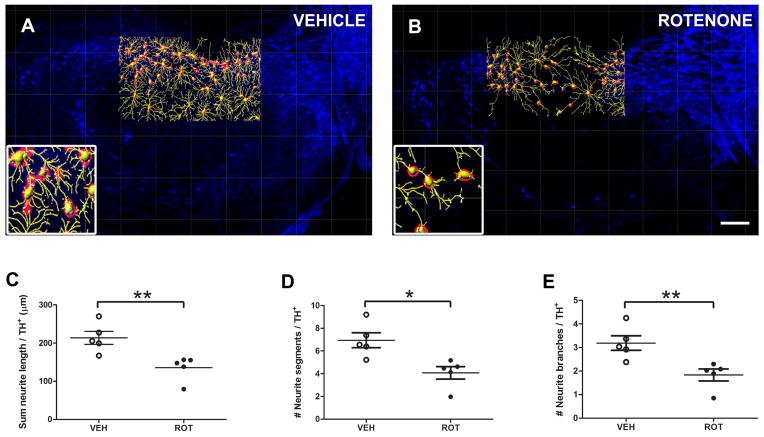
Figure 5.
Neurite morphometry in vivo. Identical sections used for neuron quantification were analyzed for neuronal filaments using Imaris software. TH+ labeling in control (A) and rotenone-treated (B) animals within the entire SN pars compacta reveals a significant decrease in neurite density. Neurites were pseudo-colored yellow, and DA neurons were labeled in red. Scale bar = 200 μm. Quantitative analysis of neurite outgrowth was carried out in 3 medial SN rat sections and data is provided for the sum length (C), number of segments (D), and number of branches (E) normalized to the number of neurons. Rotenone-induced DA toxicity caused significant morphological changes relative to controls. Five animals were imaged per group. The histogram values represent the mean ± S.E.M. Significant differences between groups were determined by one-tailed Student’s t-test. ** P = 0.0079, * P = 0.0103, ** P = 0.0093 respectively, compared to vehicle.

