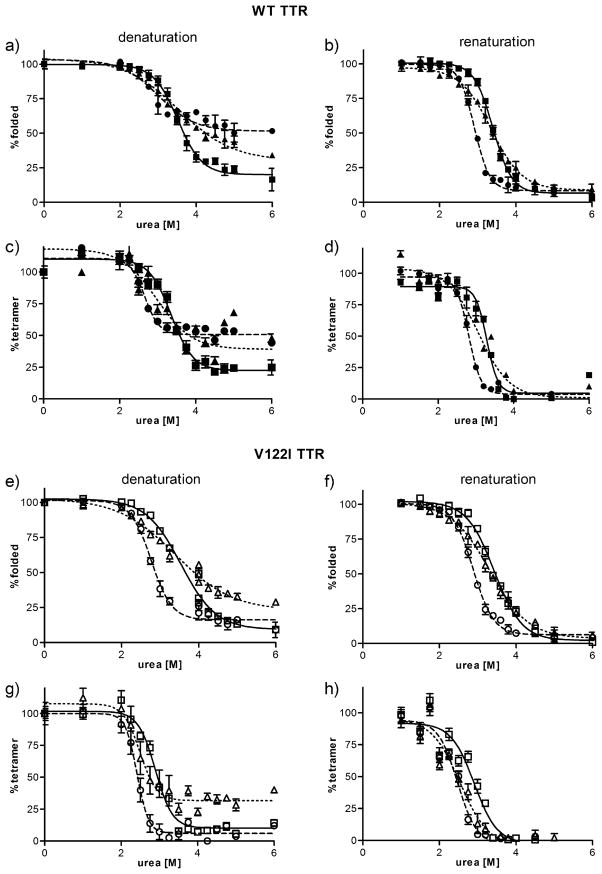
FIGURE 6.
Stability curves of native and oxidized TTR variants in urea. WT TTR and its oxidized isoforms (a–d) and V122I and its oxidized isoforms (e–h) were incubated in the presence of various concentrations of urea. The curves were generated in the denaturation direction (a, c, e, g) and in the renaturation direction (b, d, f, h). The amount of folded TTR at any given urea concentration was measured by tryptophan fluorescence (a, b, e, f) and the amount of tetrameric TTR at any given urea concentration was measured by resveratrol fluorescence (c, d, g, h). Non-oxidized TTR (solid line, squares), oxi-TTRs (broken line, circles), car-TTR (dotted line, triangles). WT TTR and its isoforms are represented by solid symbols, V122I TTR and its oxidized isoforms are represented by open symbols. Data shown represents the average of at least 3 independent experiments performed in triplicate (mean ± SD).

