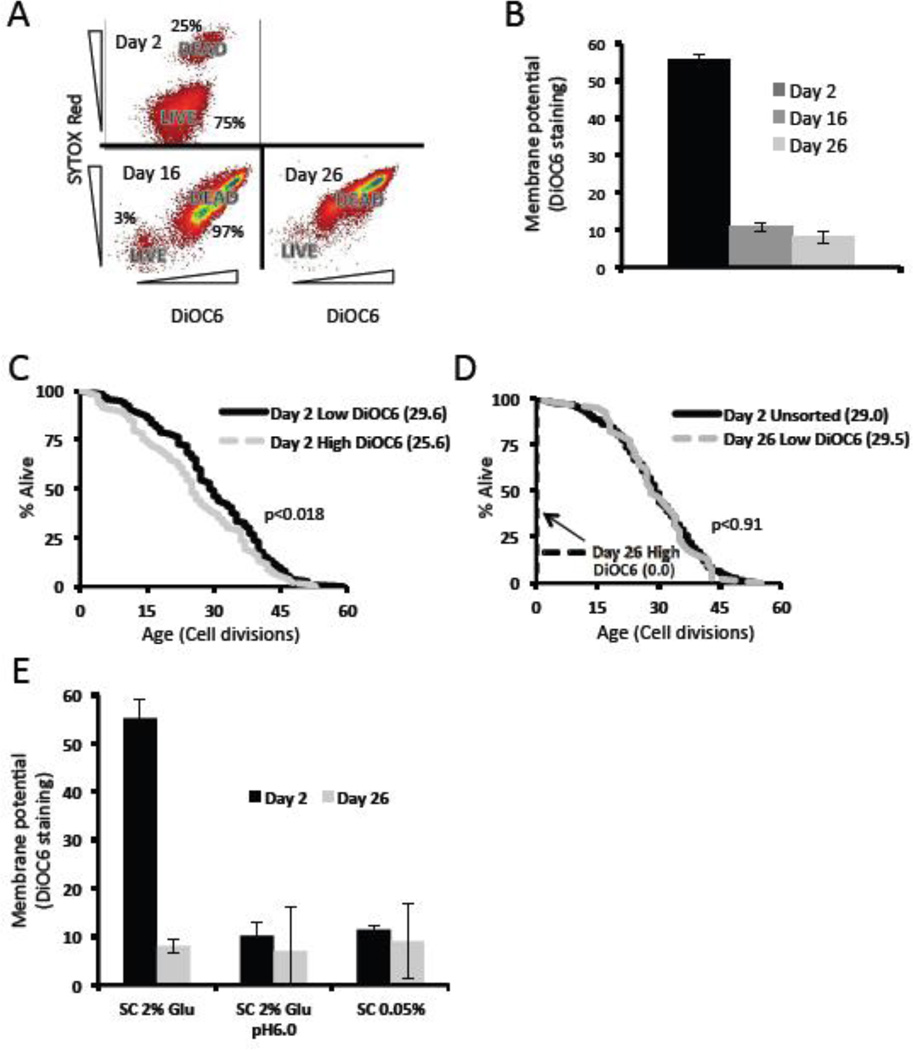
Figure 4. Low mitochondrial membrane potential during chronological aging predicts longer replicative lifespan.
(a) Chronologically aged cells were co-stained for SYTOX Red (a vital dye) and DiOC6. Only cells with low SYTOX Red content were analyzed for DiOC6 levels (labeled LIVE). Relative percentages of live and dead gates are labeled for comparison. (b) Mean DiOC6 staining of live cells during chronological aging. (c,d) Replicative lifespans of cells co-stained for SYTOX Red and DiOC6. Days refer to the days spent chronologically in 2% glucose media, and “high” and “low” refer to the highest and lowest 5–10% DiOC6 stained cells. (e) Mean DiOC6 staining of live cells subjected to the indicated media conditions during chronological aging. The percent of the cell populations that were alive based on SYTOX Red at day 2 were: SC 2% glu = 75%, SC 2% glu pH 6 = 85%, SC 0.05% glu = 84%. The percent of the cell populations that were alive based on SYTOX Red at day 26 were: SC 2% glu = 2.8%, SC 2% glu pH 6 = 75%, SC 0.05% glu = 79%.

