Fig. 2.
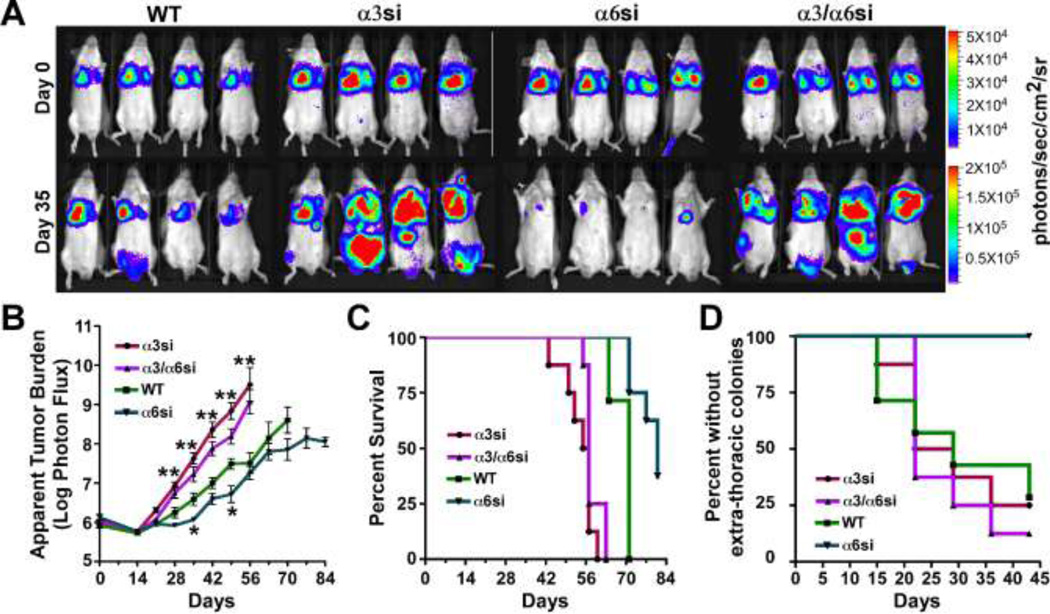
Divergent functions for α3 and α6 integrins in metastatic colonization of GS689.Li prostate carcinoma cells. a Bioluminescence imaging (BLI) was used to visualize WT, α3si, α6si, and α3/α6si GS689.Li cells immediately after tail vein inoculation (Day 0) or 35 days later. Eight mice per cell type were injected, four of each group are depicted. Note that the photon flux color scale is 4 fold higher on week 5 than on day 0. b The average apparent tumor burden for each group was measured each week by BLI, as described in Materials and Methods. Statistical analysis: significantly different from WT parental cells, ANOVA with Dunnett t test (*p<0.05, **p<0.01 or lower). c Kaplan-Meier analysis of the percent survival to endpoint for the 8 mice per group (using criteria described in Materials and Methods) revealed significantly reduced survival times for α3si and α3/α6si cells (p<0.0002) and significantly increased survival time for α6si cells (p<0.003) as compared to WT parental cells. d Kaplan-Meier analysis of extra-thoracic colonization revealed significantly reduced colonization for α6si cells compared to the other groups (p<0.004).

