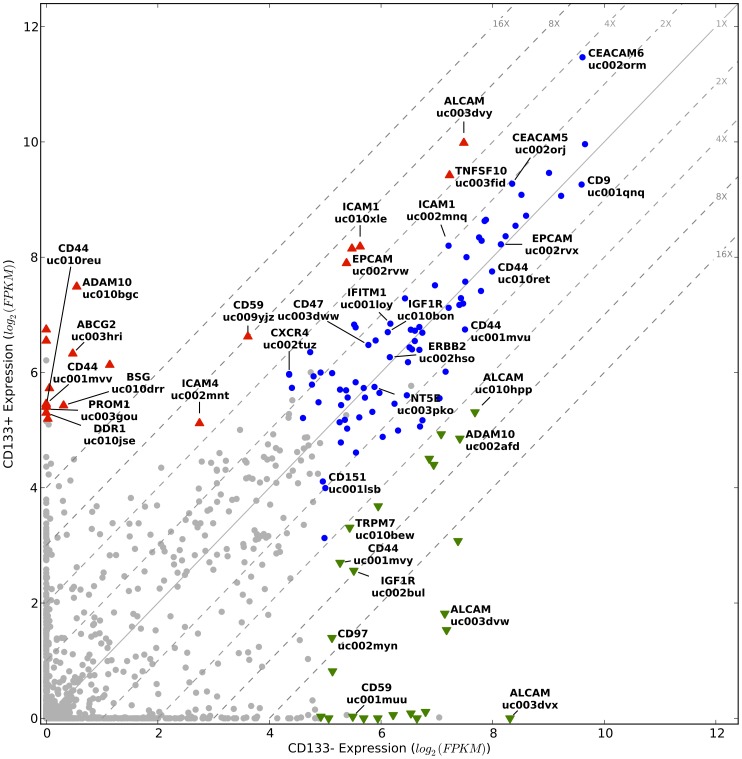
Figure 3. Isoform expression of cell surface genes in CD133+ and CD133− subpopulations.
Displayed are the expression levels of 1,191 isoforms of 426 CD Molecule, 354 GPCR and 212 ion channel genes. Grey circles correspond to isoforms that did not meet our minimum expression level criteria and blue circles to isoforms that did but were not significantly differentially expressed. Colored triangles indicate significantly differentially expressed isoforms; green down-pointing triangles indicate decreased expression and red up-pointing triangles indicate increased expression in the CD133+ cells. The diagonal grey lines are fold change clines. Isoforms discussed in the text are named. Note that CD133/PROM1 does not meet our expression criterion, underlying the stringency of our data filtering; but is shown for comparison. Here we use HGNC-approved gene symbols [96] and UCSC isoform designations [31].

