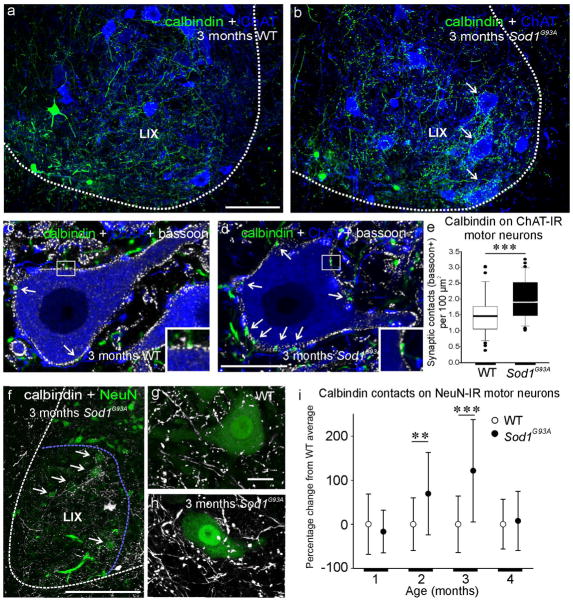
Figure 6.
Renshaw cell calbindin-IR axons in relation to motor neurons. (a-b) Low magnification confocal image of calbindin-IR axons (green, FITC) and ChAT-IR motor neurons (blue, Cy5) in 3 months old WT and a Sod1G93A mouse. Note increased density of calbindin-IR axons over certain motor neurons in the Sod1G93A mouse. (c-d) Higher magnification single optical confocal section images of calbindin-IR axons and ChAT-IR motor neurons also showing bassoon immunoreactivity (white, Cy3). All calbindin varicosities in contacts with the motor neurons surface (arrows) contain bassoon demonstrating the presence of a synaptic active zone (insets). (e) Box and whisker plot of the density of synaptic (bassoon+) calbindin contacts on the somata of ChAT-IR motor neurons. Sample contains 36 motor neurons in each group and the plot shows the median value(line), 75th (upper box), 25th (lower box), 10th and 90th(error bars) percentiles and position of the outliers (individual data points). Note presence of statistical significance (asterisksi ndicate p<0.001, t-tests) despite high variability in contact density from motor neuron to motor neuron. (f) Calbindin-IR axons and NeuN-IR motor neurons in a3 month Sod1G93A mouse. Areas devoid of NeuN-IR cell bodies show decreased density of calbindin-IR axons and these concentrate in regions with remaining NeuN-IR motor neurons (arrows). (g-h) Collapsed 3D images of examples of calbindin-IR axons and varicosities surrounding NeuN-IR motor neurons in WT (g), and 3 months Sod1G93A motor neurons (h). (i) Percentage change with respect to the WT averages of calbindin-IR contact density around motor neuron cell bodies. WTs and 1 and 4 month Sod1G93A mice show similar variability and average densities. Error bars represent SDs. Sod1G93A animals at 2 and 3 months of age show significant increases in contact density compared to their age-matched WTs (p<0.01 and p<0,001, respectively, t-tests) and also higher standard deviations (error bars) suggesting large variability (cells varied from 50% decrease to >350% increases in contact density with respect their age-matched WT average). Scale bars: in a, 100 μm(b is at the same magnification); in d, 20 μm (c is at the same magnification); in f, 250 μm; in g,20 μm (h is at the same magnification).

