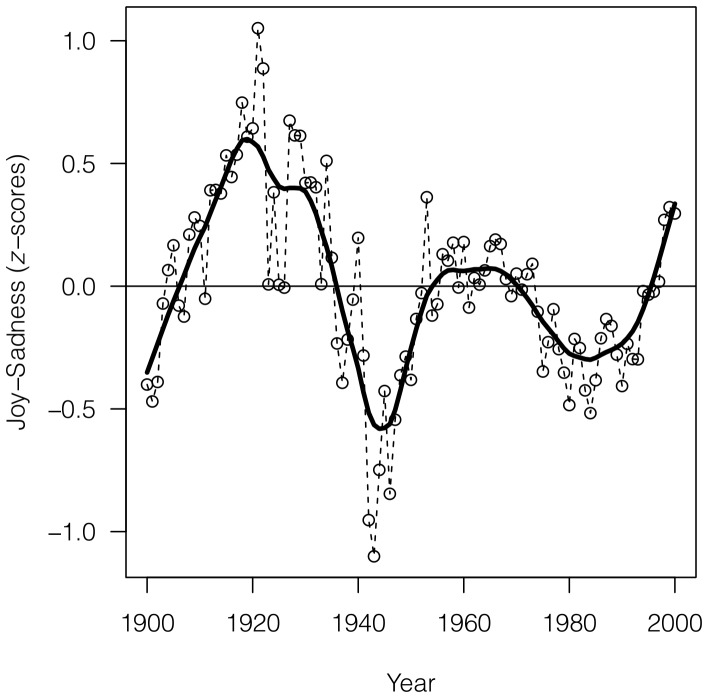
Figure 1. Historical periods of positive and negative moods.
Difference between  -scores of Joy and Sadness for years from 1900 to 2000 (raw data and smoothed trend). Values above zero indicate generally ‘happy’ periods, and values below the zero indicate generally ‘sad’ periods. Values are smoothed using Friedman's ‘super smoother' through R function supsmu() [47].

