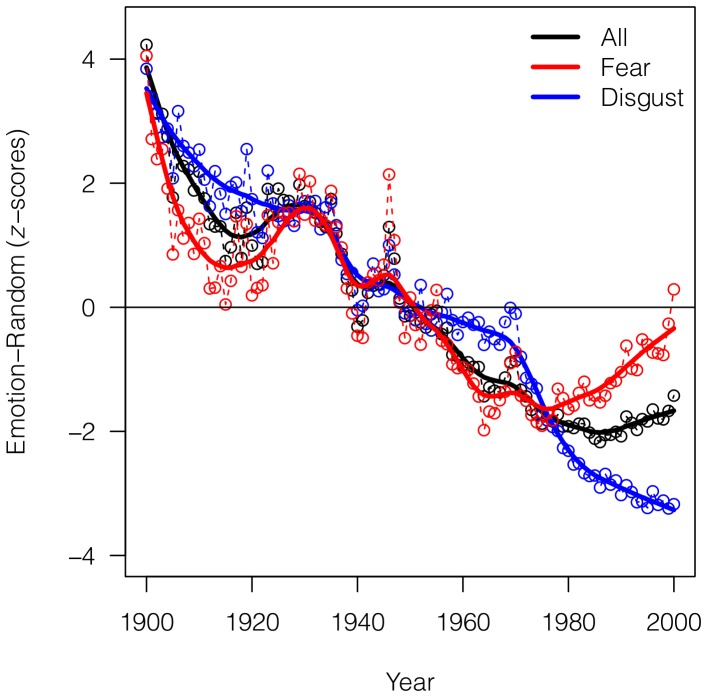
Figure 2. Decrease in the use of emotion-related words through time.
Difference between  -scores of the six emotions and of a random sample of stems (see Methods) for years from 1900 to 2000 (raw data and smoothed trend). Red: the trend for Fear (raw data and smoothed trend), the emotion with the highest final value. Blue: the trend for Disgust (raw data and smoothed trend), the emotion with the lowest final value. Values are smoothed using Friedman's ‘super smoother’ through R function supsmu() [47].

