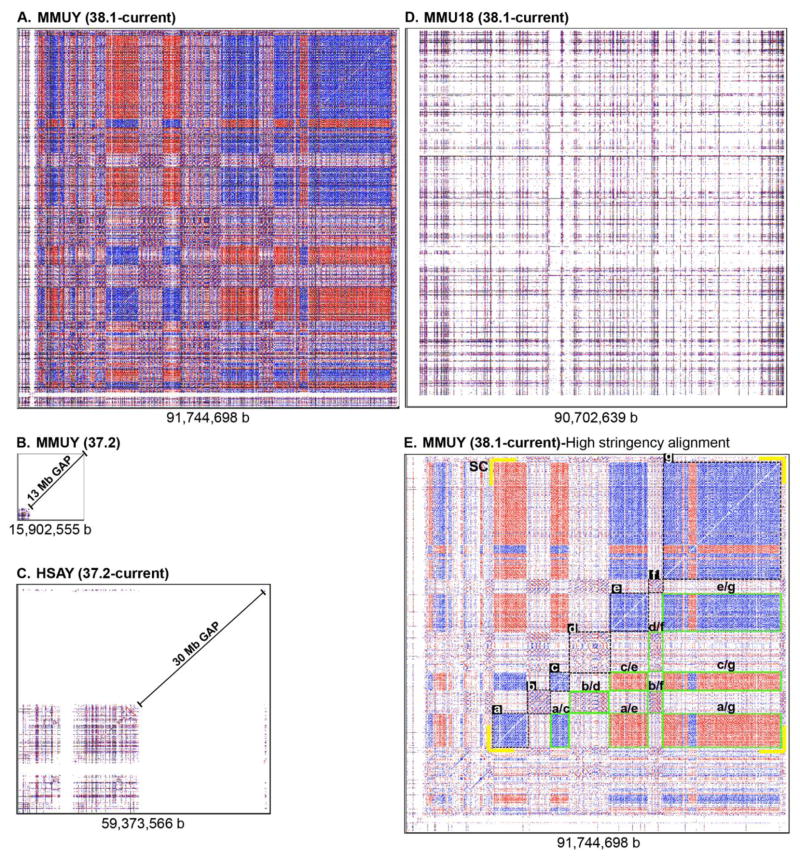
Figure 1. Existence of large interrelated clusters of REs and RE arrays in MMUY (Build 38.1).
A–D. Four different chromosome sequences (A. MMUY [NCBI Build 38.1], B. MMUY [Build 37.2], C. HSAY [Build 37.2], and D. MMU18 [Build 38.1]) were subjected to unbiased mining of REs and RE arrays using the REMiner-II program (Kim et al. 2012), and the results are presented as a dot-matrix plot. Blue and red colors indicate direct and inverse relationships between REs, respectively. The length of each chromosome sequence is indicated under each plot. E. In an attempt to increase the contrast of putative clusters of REs and RE arrays in the dot-matrix plot, the seed length was increased from 56 to 448 during the mining of REs and RE arrays. A high contrast dot-matrix plot of MMUY (Build 38.1) reveals distinct clusters formed with diverse REs and RE arrays. The seven dot-matrix plot regions, which are selected as the primary clusters (a–g) of RE arrays, are identified with dotted lines. The secondary clusters, which are formed with a pair of discontinuously related primary clusters, are outlined in green (e.g., cluster a/c). In addition, the super cluster (SC), spanning from ~20.9 Mb to ~89.4 Mb, is indicated with yellow brackets at the four corners. MMUY (Mus musculus chromosome Y), HSAY (Homo sapiens chromosome Y), MMU18 (Mus musculus chromosome 18), and b (base pair).

