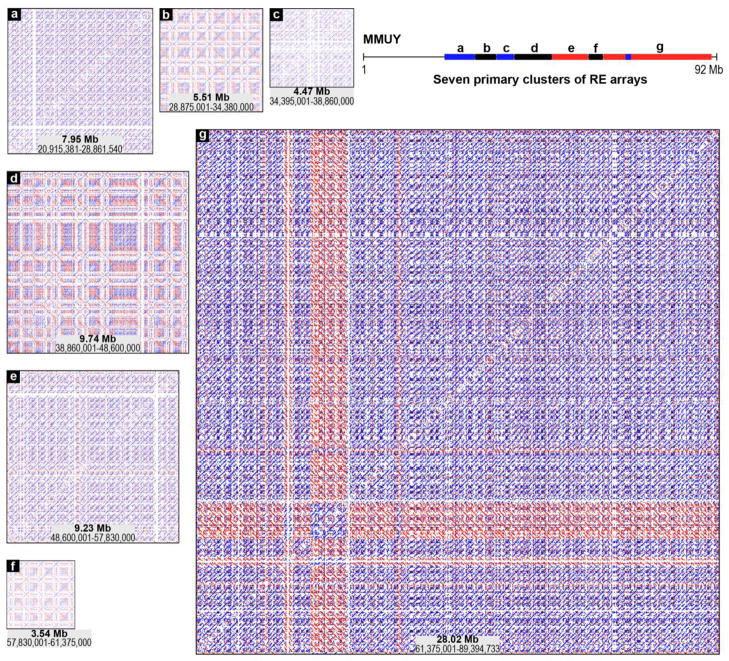
Figure 2. Structural details of clusters formed with diverse REs and RE arrays.
Structural details of seven primary clusters of MMUY (Build 38.1) (a ~ g clusters identified in panel E of Figure 1) are presented by magnification of the dot-matrix plot data using the REMiner-II viewer. Both size and chromosomal coordinate information are provided for each cluster. In addition, the relative locations of the individual clusters (a ~ g) are indicated on a line map of MMUY.

